Teaching-Learning Process Self-Efficacy Beliefs Scale (TLPSEBS) for Academic Staff: A Scale Development Study
1The Ministry of Education, Mersin, Turkey.
2Mersin University, Education Faculty, Department of Curriculum and Instruction, Turkey.
Abstract
A valid and reliable measurement tool has been developed to measure the teaching-learning process self-efficacy of instructors in higher education institutions. During the scale development stage, the scale form was e-mailed to 305 instructors, who were selected through purposive sampling method, working at the faculties of health, social, science, fine arts and engineering of the randomly determined universities in 7 regions of Turkey. As a result of the explanatory factor analysis, the 8 items were excluded from the scale and the single-factor scale with remaining 40 items explained 58,309% of the total variance. The internal consistency coefficient (Cronbach’s alpha) of the scale was found to be .98 for the whole scale. It was concluded according to these findings that the scale developed in this study is a valid and reliable measurement tool that can be used to measure the teaching-learning process self-efficacy of the instructors working in higher education institutions.
Keywords:Academic staff, Higher education, Scale development, Self-efficacy beliefs, Instructor, Teaching-learning processes.
Contribution of this paper to the literature
In this study, it is aimed to develop a measurement tool that can be used to measure the competencies of academic staff towards student-centered teaching-learning processes. Accordingly, the self-efficacy scale developed in the study will contribute to the field.
1. Introduction
Teaching-learning processes, also called educational situations, are the areas where the instructors focus most in terms of influencing and determining educational outcomes. The activity which we call learning in the classroom consists of three main areas: The subject to be learned, the process in which the subject will be learned (teaching-learning process) and the conditions that affect the student's learning (Alkan, 1987). Teaching-learning processes refer to employing the learning experiences by enabling the students to acquire the desired characteristics by organizing necessary stimulants (Demirel, 2005; Sonmez, 2005). According to Demirel (2002) the teaching-learning processes mean the learning experiences for the students, and the planning and employment of the teaching experiences for the teachers. Huitt (2003) defines the teaching/learning process as a four-step operational framework called “context, input, classroom processes and output”. The teaching-learning process has a central importance in the function of the education system, in other words, the formation of valid learning (Senemoglu, 1987). Teaching and learning process is actually aspects of the same process from different angles. Regarding teachers’ perspectives, this process refers to the teaching since the students are provided with the behaviours of which objectives are predetermined, while it is the learning from the point of view of the student because of the change in behaviour. Therefore, the process of teaching and learning is also called “teaching” (Oztürk, 2007). The teaching-learning process is the development of student behaviours that the curriculum aims to achieve. Program planning sets out the objectives for this task and proposes teaching processes to achieve these objectives. In the teaching-learning process, it is expected to make the necessary regulations for this plan to be implemented (Oliver, 1977). With the emergence of educational technology as a discipline in the 1960s, it was aimed to innovate the teaching-learning processes and make learning easy and qualified for all people (Fidan, 1986). The understanding of modern education, which has been developing since the 1960s, has directed the students towards “learning to learn” activities rather than directly conveying information to them, transformed the role of the teacher in the classroom from only conveying the information to the students and equipping them with pure knowledge to finding the necessary information in the solution of the problems, synthesizing and, more clearly, teaching the student's self-learning (Edeer, 2005; Gecer and Ozel, 2012). Teaching-learning processes can be engendered by the factors such as teacher-student profiles, applied methods, techniques, strategy and educational environment. The effect of each factor in this process has a specific value; yet, it can be said that teacher and student profiles have a power that can affect all factors (Demir and Akınoglu, 2010). “Teaching and learning process” is considered as a qualification title in the general qualifications guide of the teaching profession prepared by the Ministry of National Education (2006). It is stated under this title that “the teacher plans, implements and manages the teaching and learning processes and ensures the effective participation of the students in the learning process”. In this regard, teachers or instructors are expected to have the efficacy in strategy method and technical dimension, material design dimension and especially technology use dimension of teaching-learning process. It is necessary for the quality of education that teachers and instructors have high beliefs of efficacy for teaching-learning processes. Because the individual's judgment about his own efficacy determines whether he will start an activity and how successful he will be in the activity. Teachers' values and beliefs, knowledge, thinking and communication skills, performance skills and personality involve teacher characteristics (Huitt, 2003). According to Ashton (1984) the most important teacher trait is the teacher's values and belief, or more specifically, teacher self-efficacy. This variable is a measure of the belief that the teacher can teach and that the students can learn.
Bandura (1977a; 1977b) described the self-efficacy as the individual's judgment of his own competence. The concept of self-efficacy is based on Bandura (1977a) self-efficacy theory and forms the basis of the concept of teacher efficacy (Aktag and Walter, 2005). Bandura (1977a) self-efficacy belief theory can be used to determine the level of beliefs that teachers can meet the competencies required by the teaching profession which can be used to explain human behaviours, and to predict their behaviours of teaching tasks and responsibilities. When it comes to the competencies required by the teaching profession, it is seen that one of the important concepts related to this subject is self-efficacy. It has been revealed in a great number of studies that teachers' self-efficacy belief is considered as an important variable affecting teaching-learning processes (Woolfolk and Hoy, 1990; Tschannen-Moran et al., 1998; Henson et al., 2001; Tschannen-Moran and Hoy, 2001; Shaughnessy, 2004) .
It is seen in the literature that teachers’ beliefs of self-efficacy related to teaching-learning processes were mostly studied (Guskey, 1988; Pajares, 1992; Cetinkaya, 2007; Ozerkan, 2007; Klassen and Chiu, 2010; Benzer, 2011; Deniz, 2013; Ekinci, 2015; Sahan and Zöğ, 2017; Schipper et al., 2018) ; on the other hand, there are a small number of studies that investigate the teaching-learning process self-efficacy beliefs of instructors in higher education institutions (Busch et al., 1998; Bailey, 1999; Zhao et al., 2008; Evans and Tress, 2009) . In this respect, it was found that the majority of the measurement tools developed to measure the self-efficacy beliefs for teaching and learning processes were developed to determine the self-efficacy beliefs of teachers and prospective teachers (Gibson and Dembo, 1984; Guskey and Passaro, 1994; Tschannen-Moran and Hoy, 2001; Senemoglu et al., 2006; Ozdemir, 2008) while a limited number of measurement tools have been developed to determine self-efficacy beliefs of instructors for teaching and learning processes (Busch et al., 1998; Schoen and Wıncour, 1998) .
It was found that there was no measurement tool to measure the self-efficacy beliefs of the instructors in higher education for the teaching-learning processes which involve student-centered approaches and effectively employ information communication technologies (mobile learning, e-learning, augmented reality, virtual reality, web2 tools, etc.). Accordingly, the scale developed in this study was prepared to be used in the determining self-efficacy beliefs of instructors for teaching-learning processes in today's higher education. The absence of such a scale in the literature contributes to the importance of this study. The scale is expected to make a significant contribution to the educational sciences and higher education in Turkish and international literature. The measurement of self-efficacy beliefs of instructors for teaching-learning processes can be used as an indicator in creating the content and structure of trainer training programs that will be held to ensure the academic and professional development of the instructors. In addition, the scale is a measurement tool that can also be used to test the effectiveness of trainer training programs.
2. Method
2.1. Scale Development
The purpose of the study is to develop a measurement tool that can measure the teaching-learning process self-efficacy beliefs of instructors (professors, associate professors, assistant professors, lecturers, research assistants, etc.) in higher education institutions. Therefore, the study was conducted in accordance with the principles of scale development. Scale development is a process of developing a reliable and valid measure of a construct in order to assess an attribute of interest. Industrial-Organizational research involves the measurement of organizational and psychological constructs, which present unique challenges because they are generally unobservable (e.g. work attitudes, beliefs, personality traits) (Tay and Jebb, 2017).
2.2. Participants
The data for the scale were collected from 305 instructors who work at the faculties of health, social, science, fine arts and engineering of the randomly determined universities in 7 regions of Turkey and responded to scale forms that were e-mailed to them. With regard to the sample size, 50 samples are considered very weak, 100 samples are poor, 200 samples are sufficient and 300 samples are good. As a general rule, 300 observations are considered sufficient for factor analysis (Tabachnick and Fidell, 2001). In this study, 305 instructors were reached. Accordingly, this number is agreed to be a sufficient number of observations for factor analysis. Scale forms prepared by “google document’s” were emailed to 7519 instructors working in the related departments of the predetermined universities. About 5% of the 7519 scales were responded. In this respect, non-random sampling method was employed as sampling method. Non-random sampling is the sampling method in which the units to be sampled are determined regardless of the principle of non-randomness (Buyukozturk, 2012). Non-random sampling methods are classified in three methods as systematic sampling, purposive sampling and convenience sampling (Buyukozturk et al., 2008). In this study, it was decided to use “purposive sampling” of these methods. The basis of this sampling is to take one or more sub-sections of a universe as a sample instead of taking a representative sample for the purposes of the research. In other words, purposive sampling refers to observing the most appropriate part of the universe for the problem (Sencer, 1989). Purposive sampling is the selection of information-rich situations for the purpose of the study in order to conduct an in-depth research. There are 6 purposeful sampling techniques: deviant case, maximum variation, homogeneous, typical case, stratified purposive and criterion purposive. “Typical case sampling technique” was used in this study. The typical case sampling technique is that the sample is constructed with one typical of a large number of situations in the universe related to the research problem. It is the selection of an average, typical situation that is not unusual, such as choosing several schools in the city centre that can reflect relatively the general (Buyukozturk, 2012). In this study, one or several universities from each region were included in the sample group instead of taking the universe of all universities. Moreover, the instructors in five different faculties (science, social sciences, engineering, health and fine arts) of these universities were included in the sample group. For this reason, since we selected some typical ones of the many cases in the universe related to the research problem, the typical case sampling technique, which is one of the purposive sampling methods, was used.
2.3. Instrument
In the first stage of the development of the scale, the variables that affect the expected competencies and self-efficacy beliefs in teaching-learning processes from the instructors working in higher education institutions were examined. For this purpose, a focus group interview was conducted with 6 lecturers who are experts in the field of educational sciences working in curriculum and instruction department and relevant literature was searched. Using the findings obtained from the focus group interview and the data in the relevant literature, a draft scale form of 55 items which was considered to be an indicator of factors was created.
In the second stage, the draft scale form was presented to the opinions of the instructors who had previously done academic studies in the field of teaching-learning processes. For this purpose, the opinions of 6 instructors in the Department of Curriculum and Instruction, 1 instructor in the Department of Classroom Education and 1 instructor in the Department of Test and Assessment in Education were obtained in relation to the items. Upon taking the expert opinions, it was determined how many experts voted for each item. Lawshe technique developed by Lawshe (1975) was used to calculate the content validity. In this technique, the opinions of experts about an item are added up each other and content validity rates are obtained. The value that is 1 below the ratio of the number of experts evaluating the item as “necessary (valid)” to the half of the total number of experts responding to the item gives the content validity rates. According to Veneziano and Hooper (1997) the minimum validity limit for the 8 expert opinions is 0.78. Since 8 experts were consulted for expert opinion in our study, the minimum value of content validity was 0.78. In the last stage, the items planned to be included in the draft form of the scale were examined separately and 7 items whose content validity value was below 0.78 were removed from the form. Thus, a 48-item form was prepared for the factor analysis using a 5-point Likert-type scale (5:the most,……, 1:the least) through which the participants could indicate how much each statement reflects their self-efficacy.
2.4. Data Analysis
In order to ensure the construct validity of Teaching-Learning Process Self-Efficacy Beliefs Scale (TLPSEBS), pilot study of the scale form was completed with 84 instructors of University. The results obtained at the end of this pilot study were similar to the results obtained from 305 instructors who afterwards responded to scale. Cronbach-alpha internal consistency coefficient was found to be “.96” at the end of the pilot study. In addition, the KMO value, which indicates the sampling adequacy of the scale, was calculated as “.85”. KMO value is seen to be between 0 and 1. According to the literature, a value between 0.8 and 0.9 is considered to be very good (Field, 2009; Alpar, 2012). This result shows that the data are quite suitable for factor analysis.
2.5. Testing the Hypotheses for Construct Validity
The measurement tool is tested to ensure that each structure in the structural model is measured with a valid and reliable measuring tool (Nunnally, 1967). There are a number of methods to test the validity and reliability of the measurement tool that is employed or prepared. Explanatory factor analysis has an important place especially for validity tests. In the explanatory factor analysis, it is aimed to find a small number of conceptually significant new factors based on the relationships between the variables by bringing together the interrelated p number of variables (Buyukozturk, 2010). In this study, in determining the validity and reliability of the scale items, explanatory factor analysis was used in the calculation of the factorability and preparation of the form containing the final items.
The following analyzes were performed in order to prove validity and reliability on the data obtained (Tezbasaran, 2008). Cronbach α internal consistency coefficients were examined for reliability. The sampling adequacy test (KMO-Kaiser-Meyer-Olkin) was used to find out the suitability of the data for principal component analysis, in other words, whether the data set was suitable for factor analysis, and the Barlett Sphericity Test (Bartlett's Test of Sphericity) to determine whether there is a relationship between the variables. Factor analysis was conducted to provide evidence of the construct validity and the control of the structure was ensured in another group to prove that the scale could provide the same structure in similar groups. The 48-item draft scale form was applied to 305 people. This number is sufficient for sample size, which is one of the basic assumptions of explanatory factor analysis. According to Tabachnick and Fidell (2001) the sample size is at least 5 times the number of items or 300 samples are sufficient for factor analysis. According to Kline (1994) the number of observations should be at least 2 times the number of items, while it should be at least 5 times the number of items according to Buyukozturk (2010).
Firstly, analysis was performed on the responses of 305 instructors after the incomplete scales which were not suitable for the validity and reliability studies of the scale were removed. Before the analysis, missing data analysis, outlier analysis and linearity test, which are of the basic assumptions of multivariate statistics, were performed. It was found as a result of the missing data analysis that the data set did not have a missing data problem and that the missing data for each cell was quite below 5%. After that, item distributions were examined for normality, and kurtosis and skewness values were calculated. Z values and Mahalanobis distances were examined for univariate and multivariate normality respectively.
No outlier was found when the univariate outliers were examined. In order to determine multivariate outliers, Z and Mahalonobis distance values were compared to X² (chi square) value (X²48, 0,05=67.51) at 0.05 level, and accordingly, a total of total 43 data higher than X² value (Demirutku et al., 2005) were deleted. Coefficient of multiple determination, correlations between variables, tolerance values or variance inflation factors (VIF) can be used to determine multicollinearity. In this study, variance inflation factors (VIF) and tolerance values were applied. The VIF value is expected to be less than 10 and the tolerance value to be between .20 and 1 (Tabachnick and Fidell, 2001; Alpar, 2003; Field, 2009; Buyukozturk, 2010; Alpar, 2012) . As a result of the analysis, all VIF values were found to be less than 10 (between 2.00 and 7.56) and tolerance values were greater than 0.20 (between 0.20 and 0.50). Durbin-Watson statistics were used to determine the independence of the errors in the study. The Durbin-Watson statistic value between 0 and 4 and the result close to 2 shows that the errors are independent (Tabachnick and Fidell, 2001). Table 1 below shows the values for Durbin-Watson statistics.
Model |
R |
R square |
Adjusted R square |
Std. Error of the estimate |
Durbin-Watson |
1 |
,452(a) |
,204 |
,025 |
87,35443 |
1,852 |
Durbin-Watson statistics examined for independence of errors in this study were found in the expected range (1,85). The fact that the result was close to 2 is considered as an indication that the errors were independent.
KMO (The Kaiser-Meyer-Olkin Measure of Sampling Adequacy) test was used to determine the suitability of the data for factor analysis and Barlett's Sphericity test to examine the suitability of this matrix. The data for the tests are given in Table 2.
| Kaiser-Meyer-Olkin Sampling Adequacy Test | ,970 |
|
| Barlett’ s Sphericity Test | x² |
12020,436 |
Sd |
1128 |
|
p |
,000 |
|
According to Table 2 KMO test was found out as 0.970 and, as a result of Barlett’s-Test, the x² statistic calculated at p=0.05 was significant (x²=12020,436, p<0.05, sd=1128). The fact that the chi-square test statistics obtained as a result of this test is significant indicates that the data show a multivariate normal distribution (Alpar, 2012). KMO value in this study was found to be 0.97. The KMO value that is greater than 0.60 indicates the suitability of the structure for factor analysis (Kaya, 2005; Simşek, 2007). It was decided based on these results that the data set was suitable for Explanatory Factor Analysis.
3. Results
3.1. Exploratory Factor Analysis
Eigenvalue statistics and scree plot diagrams were used to determine the number of factors. The factor loads of 48 items were examined with explanatory factor analysis. The relationships between the factors that were found with factor analysis were not significant at p<.01 level. Varimax vertical rotation technique was used as a rotation technique as a result of factor analysis of the scale to determine whether the items were separated into significant independent factors (Tabachnick and Fidell, 2001; Field, 2009). As a result of the analysis, a 5-factor structure with an eigenvalue of 1 or more was revealed. It was taken into consideration in the explanatory factor analysis that the eigenvalues of the items should be 1 or more, the items' load value should be at least 0.30, the items should be included in a single factor and there would be at least 0.10 of difference between the factors in the two factors (Buyukozturk, 2005). Factors with an eigenvalue higher than 1 and their variances are given in Table 3.
Factor |
Eigenvalue |
Explained variance (%) |
Total explained variance (%) |
1 |
26,956 |
56,158 |
56,158 |
2 |
2,138 |
4,454 |
60,612 |
3 |
1,563 |
3,256 |
63,867 |
4 |
1,235 |
2,573 |
66,440 |
5 |
1,035 |
2,157 |
68,597 |
According to Table 3 the scale is seen to have a 5-factor structure. That is because the eigenvalues of the 5 components in the scale are greater than 1. The total variance of these 5 components to explain the scale was found as 68.59%. However, the contribution of each sub-factor to the scale needs to be evaluated. As seen in Table 3 the contribution of the first factor to the variance in the scale is far above of other factors. Factor 1 contributes 56.15% to the scale alone. The contribution of other factors appears to decrease gradually. This structure is an indicator that the scale can be formed under one factor. A high percentage of explained variance in a single factor can be considered as an important indicator that this structure is a single factor (Kuzucu, 2008).
In order to form a single factor structure, it is emphasized that the first factor needs to explain at least 30% of the variance and also the eigenvalue of the first factor must be at least 3–3.5 times greater than the second factor (Buyukozturk, 2005; Kaya, 2005; Gokkus et al., 2016) . According to the findings of the study, 56.158% of the variance is explained by the first factor while 4,454% by the 2nd factor, 3,256% by the 3rd factor, 2,573% by the 4th factor and 2,157% by the 5th factor. These findings show that the variance value of factor 1 is more than 12 times the variance value of factor 2. Moreover, the fact that the second factor and the subsequent factor variance values were close to each other refers to a single factor structure.
Since the scale was suitable for a single factor structure, no rotation technique was needed to be applied in factor analysis (Gokkus et al., 2016). Table 4 below depicts that the covariance values of the 48 items in the scale range between 0.496 and 0.821. It was observed that the variance values of the items in the scale were found generally as 0.60 and above. This can be accepted as an indicator that scale items are pretty good to measure the structure to be measured.
Factor load value is defined as a coefficient explaining the relationship between items and factors. It is expected in the studies that the load values of the factors which contain the items are high. According to Buyukozturk (2010); regardless of positive or negative, the load value of 0.60 and above is generally described as high while the load value between 0.30-0.59 is defined as moderate, which is taken into account in excluding variable. If there is a group of items that provide a high level of relationship with a factor, it means that these items together measure a concept-structure-factor well enough. As it was aimed in the study to develop a measurement tool that would enable the structure to be measured with high adequacy, the factor load value limit was determined as “.60”. A total of 6 items such as item 1 (.570), item 4 (.496), item 7 (.597), item 10 (.590), item 15 (.580) and item 20 (.548), of which factor load values are below .60, were excluded from the scale. The results of the factor loads obtained from the analysis of the scale data are given in Table 4.
Item no |
Component matrix |
Item no |
Component matrix |
1 |
.570* |
25 |
.610 |
2 |
.600 |
26 |
.796 |
3 |
.767 |
27 |
.804 |
4 |
.496* |
28 |
.612 |
5 |
.744 |
29 |
.671 |
6 |
.714 |
30 |
.623 |
7 |
.597* |
31 |
.654 |
8 |
.706 |
32 |
.760 |
9 |
.635 |
33 |
.795 |
10 |
.590* |
34 |
.691 |
11 |
.694 |
35 |
.792 |
12 |
.726 |
36 |
.703 |
13 |
.615 |
37 |
.749 |
14 |
.724 |
38 |
.757 |
15 |
.580* |
39 |
.785 |
16 |
.650 |
40 |
.658 |
17 |
.794 |
41 |
.679 |
18 |
.724 |
42 |
.821 |
19 |
.610 |
43 |
.672 |
20 |
.548* |
44 |
.676 |
21 |
.768 |
45 |
.651 |
22 |
.609 |
46 |
.653 |
23 |
.697 |
47 |
.691 |
24 |
.711 |
48 |
.752 |
The items with the (*) mark are the ones that give a value below .60 before the single factor structure of the scale was examined.
After excluding the items, the scale was re-examined as a single factor structure with 42 items. The scree plot diagram of the single factor structure is shown in Figure 1.
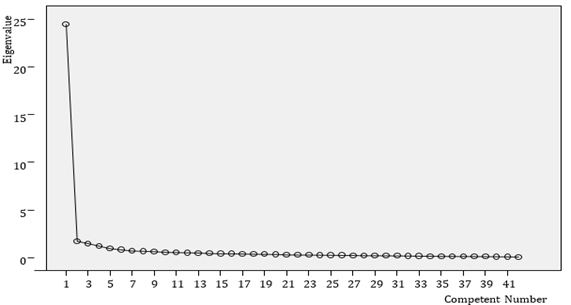
Figure-1. Teaching-learning process self-efficacy beliefs scale (TLPSEBS) scree plot diagram. |
As can be seen in the scree plot diagram above, the scale shows a single factor structure. In line with the premises of explanatory factor analysis, KMO (The Kaiser-Meyer-Olkin Measure of Sampling Adequacy) test was used to determine whether the data related to the single factor structure was suitable for factor analysis, and Barlett’s test of Sphericity to test the suitability of this matrix. In addition, the variance explained by the 42-item scale, the load values of the items and the common item variance results were also examined.
| Kaiser-Meyer-Olkin Sampling Adequacy Test | ,973 |
|
| Barlett’ s Sphericity Test | x² |
10695,348 |
sd |
861 |
|
p |
,000 |
|
According to Table 5 above, KMO test was found out as 0.973 and, as a result of Barlett’s-Test, the x² (chi-square) statistic calculated at p=0.05 was significant (x²=10695,348, p<0.05, sd=861). The fact that the chi-square test statistics obtained as a result of this test is significant indicates that the data show a multivariate normal distribution (Alpar, 2012). KMO value in this study was found to be “.973”. The KMO value that is greater than 0.60 indicates the suitability of the structure for factor analysis (Kaya, 2005; Simşek, 2007; Buyukozturk, 2010) . It was decided based on these results that the data set was suitable for factor analysis. Eigenvalue statistics and scree plot diagrams were used to determine the number of factors. The factor loads of 42 items were examined with explanatory factor analysis. The relationships between the factors that were found with factor analysis were not significant at p<.05 level. Table 6 below shows the eigenvalue and variance percentage values that were found by the second analysis.
Component |
Initial eigenvalues |
Sum of load squares |
||||
Total |
Variance % |
Total |
Variance % |
Total |
Variance % |
|
1 |
24,490 |
58,309 |
58,309 |
24,490 |
58,309 |
58,309 |
2 |
1,729 |
4,116 |
62,426 |
|||
3 |
1,495 |
3,559 |
65,984 |
|||
4 |
1,222 |
2,910 |
68,894 |
|||
5 |
,955 |
2,273 |
71,167 |
|||
6 |
,836 |
1,990 |
73,157 |
|||
7 |
,711 |
1,693 |
74,850 |
|||
8 |
,686 |
1,634 |
76,485 |
|||
9 |
,643 |
1,532 |
78,017 |
|||
10 |
,572 |
1,362 |
79,378 |
|||
11 |
,555 |
1,321 |
80,700 |
|||
12 |
,525 |
1,251 |
81,951 |
|||
13 |
,505 |
1,201 |
83,152 |
|||
14 |
,454 |
1,080 |
84,232 |
|||
15 |
,428 |
1,020 |
85,252 |
|||
16 |
,423 |
1,008 |
86,260 |
|||
17 |
,402 |
,956 |
87,217 |
|||
18 |
,380 |
,905 |
88,121 |
|||
19 |
,365 |
,869 |
88,991 |
|||
20 |
,351 |
,836 |
89,826 |
|||
21 |
,311 |
,741 |
90,567 |
|||
22 |
,296 |
,705 |
91,272 |
|||
23 |
,291 |
,693 |
91,966 |
|||
24 |
,276 |
,658 |
92,624 |
|||
25 |
,266 |
,634 |
93,257 |
|||
26 |
,250 |
,596 |
93,853 |
|||
27 |
,241 |
,573 |
94,427 |
|||
28 |
,223 |
,530 |
94,957 |
|||
29 |
,220 |
,524 |
95,480 |
|||
30 |
,208 |
,496 |
95,976 |
|||
31 |
,199 |
,474 |
96,450 |
|||
32 |
,186 |
,442 |
96,892 |
|||
33 |
,172 |
,410 |
97,302 |
|||
34 |
,165 |
,392 |
97,694 |
|||
35 |
,150 |
,357 |
98,051 |
|||
36 |
,144 |
,343 |
98,394 |
|||
37 |
,130 |
,310 |
98,705 |
|||
38 |
,129 |
,307 |
99,012 |
|||
39 |
,119 |
,283 |
99,295 |
|||
40 |
,111 |
,265 |
99,560 |
|||
41 |
,103 |
,244 |
99,805 |
|||
42 |
,082 |
,195 |
100,000 |
|||
The number of factors with eigenvalues above 1 is 4 according to Table 6. However, the explained total variance and scree plot diagram were examined together and the number of factors was determined as the single factor with regard to the theoretical structure. It is evident from the findings that the variance explained in the single factor structure is 58,309%. According to Tavsancil (2010) the fact that explained variance is 30% or more is sufficient to explain the structure. In the study, the explained variance of the scale in the single factor structure was found to be 58,309%, which is taken as an indicator that the scale is well enough to measure the to-be-measured structure in a single factor. It was concluded based on these results that the data set had a perfect fit for factor analysis. As a result of the explanatory factor analysis which was examined according to the single factor structure, the factor load values and explained covariance values for the items of the scale are given in Table 7.
Item no |
Factor load |
Covariance |
Item no |
Factor load |
Covariance |
1 |
.672 |
.451 |
21 |
.744 |
.553 |
2 |
.686 |
.471 |
22 |
.733 |
.537 |
3 |
.773 |
.598 |
23 |
.754 |
.568 |
4 |
.742 |
.550 |
24 |
.797 |
.635 |
5 |
.758 |
.575 |
25 |
.803 |
.645 |
6 |
.773 |
.598 |
26 |
.825 |
.681 |
7 |
.825 |
.681 |
27 |
.866 |
.750 |
8 |
.645 |
.417 |
28 |
.810 |
.656 |
9 |
.820 |
.672 |
29 |
.845 |
.715 |
10 |
.789 |
.622 |
30 |
.718 |
.516 |
11 |
.726 |
.527 |
31 |
.867 |
.752 |
12 |
.601 |
.361 |
32 |
.776 |
.602 |
13 |
.822 |
.675 |
33 |
.779 |
.606 |
14 |
.767 |
.588 |
34 |
.883 |
.780 |
15 |
.710 |
.504 |
35 |
.778 |
.605 |
16 |
.837 |
.700 |
36 |
.708 |
.501 |
17 |
.723 |
.522 |
37 |
.711 |
.506 |
18 |
.873 |
.762 |
38 |
.745 |
.555 |
19 |
.870 |
.758 |
39 |
.699 |
.488 |
20 |
.689 |
.475 |
40 |
.803 |
.645 |
As can be seen in Table 7 the factor load values of the items of the scale were high between “.601” and “.883”. As the factor load values get higher, so does the variance ratio explained by the scale (Buyukozturk, 2010; Tavsancil, 2010). Accordingly, the percentages of variance explained by our single-factor scale were also high. According to the results of the explanatory factor analysis, 2 items (item 3, item 17) whose factor load value was less than .60 in the single factor structure were excluded from the form. The “Teaching-Learning Process Self-Efficacy Beliefs Scale (TLPSEBS)” was finalized as a single-factor structure with 40 items.
3.2. Reliability
Table 8 below shows the results of the reliability analysis of the scale.
Cronbach's alpha |
N (Number of items) |
.982 |
40 |
Regarding the reliability of the scale, Cronbach alpha internal consistency coefficient was found to be 0.982. Internal consistency coefficient of 0.70 and above is considered sufficient for the reliability of test scores (Buyukozturk, 2010). The fit indices show that the model is compatible with the data. It was concluded that the Teaching-Learning Process Self-Efficacy Beliefs Scale (TLPSEBS) developed in this study is a valid and reliable measurement tool that can be used in educational sciences.
4. Conclusion and Discussion
The aim of this study is to develop a valid and reliable measurement tool that can be used to measure the self-efficacy beliefs of the instructors in higher education institutions. The stages of the scale development process were followed in the study in order to achieve this aim (DeVellis, 2003; Erkus, 2012; Karakoc and Donmez, 2014). The format was determined for the measurement method and accordingly, an item/question repository was created. Expert opinions were resorted to determine the necessity, comprehensibility and specificity of the items that were developed. Layout, content and validity were evaluated by expert comment. After taking expert opinion, a 48-item scale form was applied to a sample group of 305 people representing the target population. A number of analyzes were performed in order to prove validity and reliability on the data (Tezbasaran, 2008). Cronbach α internal consistency coefficients were calculated to provide evidence of reliability. The sampling adequacy test (KMO-Kaiser-Meyer-Olkin) was employed to assess the suitability of the data set for factor analysis, and the Bartlett's Test of Sphericity was used to determine whether there was a relationship between variables. Explanatory factor analysis was applied on the data set in order to prove construct validity. The scale was tested on a different group to see whether it could give the same structure in similar groups, and similar results were obtained. It was seen as a result of the analyses that the scale had a single factor structure with 40 items and can be used to measure the teaching-learning processes self-efficacy beliefs of the instructors. Internal consistency and test-retest reliability were calculated for the reliability of the scale. In this study, the internal consistency coefficient of the scale was found to be 0.982. According to these values, it was accepted that the reliability coefficients of the scale were within admissible ranges. As a result, when the findings obtained from the analyses were taken into consideration, it was seen that the Teaching-Learning Process Self-Efficacy Beliefs Scale (TLPSEBS) is a valid and reliable measurement tool.
It was observed in the literature that there are various scale development studies conducted to measure the self-efficacy beliefs of the instructors parallel to the problem of this study (Busch et al., 1998; Schoen and Wıncour, 1998) . The findings of this study showed that the belief of self-efficacy for teaching-learning processes is an important variable enabling effective and efficient teaching-learning processes. The results of several studies in the literature support the results obtained in this study (Henson et al., 2001; Tschannen-Moran and Hoy, 2001; Shaughnessy, 2004; Xu, 2012; Pisciottani et al., 2019) . To conclude, the Teaching-Learning Process Self-Efficacy Beliefs Scale (TLPSEBS) is expected to contribute to the studies to be carried out to determine the self-efficacy beliefs of the instructors in higher education. This scale is also thought to meet an important need and contribute to the field of educational sciences in that it can be used to test the effectiveness of the trainer training programs to be organized for improving the competencies of the instructors.
4.1. Limitations
Scale forms were sent to 7519 instructors by e-mail, however, only 305 of them responded to it. The greatest limitation of this research was experienced during data collection from the instructors. They did not fill out the scale forms for some reasons such as work overload, sparing no time and so on. For this reason, explanatory factor analysis was conducted but confirmatory factor analysis was not applied.
References
Aktag, I. and J. Walter, 2005. Professional efficacy sense of teacher candidates. Journal of Sportmeter Physical Education and Sport Sciences, 3(4): 127-131.
Alkan, C., 1987. Learning-teaching process principles. Ankara University Journal of Educational Sciences, 20(1): 209-229.Available at: https://doi.org/10.1501/Egifak_0000001070.
Alpar, R., 2003. Introduction to multivariate statistical methods 1. Ankara: Nobel Publishing.
Alpar, R., 2012. Applied statistics and validity-reliability. Ankara: Detay Publishing.
Ashton, P., 1984. Teacher efficacy: A motivational paradigm for effective teacher education. Journal of Teacher Education, 35(5): 28-32.Available at: https://doi.org/10.1177/002248718403500507.
Bailey, J.G., 1999. Academics' motivation and self-efficacy for teaching and research. Higher Education Research & Development, 18(3): 343-359.Available at: https://doi.org/10.1080/0729436990180305.
Bandura, A., 1977a. Self-efficacy: Toward a unifying theory of behavioral change. Psychological Review, 84(2): 191-215.Available at: https://doi.org/10.1037/0033-295x.84.2.191.
Bandura, A., 1977b. Social learning theory. Englewood Cliffs. NJ: Prentice-Hall.
Benzer, F., 2011. Analysis of self-efficacy beliefs of the teachers working in primary and high school. Doctoral Dssertation, Selçuk University Instıtute of Educational Sciences, Konya.
Busch, T., L. Fallan and A. Pettersen, 1998. Disciplinary differences in job satisfaction, self‐efficacy, goal commitment and organisational commitment among faculty employees in Norwegian colleges: An empirical assessment of indicators of performance. Quality in Higher Education, 4(2): 137-157.Available at: https://doi.org/10.1080/1353832980040204.
Buyukozturk, S., 2005. Survey development. Available from http://www.bingol.edu.tr/media/226164/sayt-bolum13-anket-gelistirme.pdf.
Buyukozturk, S., 2010. Data analysis handbook for social sciences. Ankara: Pegem Akademi.
Buyukozturk, S., 2012. Sampling methods. Available from http://w3.balikesir.edu.tr/~msackes/wp/wp-content/uploads/2012/03/BAY-Final-Konulari.pdf.
Buyukozturk, S., E.K. Cakmak, O.E. Akgun, S. Karadeniz and F. Demirel, 2008. Scientific research methods. 2nd Edn., Ankara: Pegem Akademi Publishing.
Cetinkaya, R., 2007. Self-efficacy beliefs of Turkish teacher candidates and their attitudes towards teaching profession. [Doctoral dissertation, Selçuk University Instıtute of Social Sciences, Konya].
Demir, S. and O. Akınoglu, 2010. Epistemological beliefs and teaching-learning processes, Marmara University. Atatürk Faculty of Education Journal of Educational Sciences, 32(32): 75 – 93.
Demirel, O., 2002. Curriculum development: Theory and practice. Ankara: Pegem A. Publishing.
Demirel, O., 2005. Curriculum development in education. Ankara: Pegema Publishing.
Demirutku, K., N.C. Okay, A. Yaman, F.E. Kıvanc, B. Muratoglu and Z. Yeniceri, 2005. Statistical ormulas and tables. Ankara: Başkent University Faculty of Economics and Administration. Critical and Creative Thinking and Behavioral Researches Laboratory.
Deniz, S., 2013. An investigation of the learning styles and teacher self-efficacy levels of belief of pre-service teachers according to various variables. International Online Journal of Educational Sciences, 5(3): 667-684.
DeVellis, R.F., 2003. Scale development: Theory and applications. Newbury Park: Sage.
Edeer, S., 2005. Interdisciplinary approach in art education. Ondokuz Mayıs University Journal of Faculty of Education, 1(19): 78-84.
Ekinci, N., 2015. The relationships between approaches to learning and self-efficacy beliefs of candidate teachers. Hacettepe University Journal of Education, 30(1): 62-76.
Erkus, A., 2012. Testing and evaluation in psychology. Ankara: Pegem Akademi Publishing.
Evans, L. and M.B. Tress, 2009. What drives research-focused university academics to want to teach effectively?: Examining achievement, self-efficacy and self-esteem. International Journal for the Scholarship of Teaching and Learning, 3(2): 1-17.
Fidan, N., 1986. Learning and teaching at school: Conceptions, principles, method. Ankara: Kadıoğlu Publish.
Field, A., 2009. Discovering statistics using SPSS. London: Sage.
Gecer, A. and R. Ozel, 2012. Problems of elementary science teachers during teaching-learning process. Educational Sciences: Theory and Practice, 12(3): 1-26.
Gibson, S. and M.H. Dembo, 1984. Teacher efficacy: A construct validation. Journal of educational Psychology, 76(4): 569-682.Available at: https://doi.org/10.1037/0022-0663.76.4.569.
Gokkus, I., E. Kuru and A.S. Simsek, 2016. Library attitude scale: Validity and reliability study. The Journal of Academic Social Science Studies, 42(3): 465-479.
Guskey, T.R., 1988. Teacher efficacy, self-concept, and attitudes toward the implementation of instructional innovation. Teaching and Teacher Education, 4(1): 63-69.Available at: https://doi.org/10.1016/0742-051x(88)90025-x.
Guskey, T.R. and P.D. Passaro, 1994. Teacher efficacy: A study of construct dimensions. American Educational Research Journal, 31(3): 627-643.Available at: https://doi.org/10.3102/00028312031003627.
Henson, R.K., L.R. Kogan and T. Vacha-Haase, 2001. A reliability generalization study of the teacher efficacy scale and related instruments. Educational and Psychological Measurement, 61(3): 404-420.Available at: https://doi.org/10.1177/00131640121971284.
Huitt, W., 2003. A transactional framework of the teaching/learning process: Educational psychology interactive. Valdosta, GA: Valdosta State University.
Karakoc, A. and P. Donmez, 2014. Basic principles in scale development. Medical Education World, 13(40): 39-49.
Kaya, A., 2005. Validity and reliability study of the Turkish version of the children loneliness scale. Journal of Educational Research, 5(19): 220–237.
Klassen, R. and M. Chiu, 2010. Effects on teachers' self-efficacy and job satisfaction: Teacher gender, years of experience, and job stress. Journal of educational Psychology, 102(3): 741-756.Available at: https://doi.org/10.1037/a0019237.
Kline, P., 1994. An easy guide to factor analysis. New York: Routledge.
Kuzucu, Y., 2008. The adaptation of the levels of emotional awareness scale: validty and reliability studies. The Turkish Psychological Counseling and Guidance Journal, 3(29): 51-64.
Lawshe, C.H., 1975. A quantitative approach to content validity 1. Personnel Psychology, 28(4): 563-575.Available at: https://doi.org/10.1111/j.1744-6570.1975.tb01393.x.
Ministry of National Education, 2006. General competencies of teaching profession. Ankara: MoNE General Directorate of Teacher Training.
Nunnally, J.C., 1967. Psychometric theory. New York: McGraw-HillInc.
Oliver, A.I., 1977. Curriculum improvement: A guide to problems, principles, and process. Harper & Row, Michigan University.
Ozdemir, S.M., 2008. Examining the teaching process self-efficacy beliefs of the prospective classroom teachers in terms of various variables. Journal of Educational Administration in Theory and Practice, 14(2): 277-306.
Ozerkan, E., 2007. The relationship between teachers' self-efficacy beliefs and students' self identity in social studies. [Unpublished Master's Thesis, Trakya University Institute of Social Sciences, Edirne].
Oztürk, M., 2007. Planning, practice and evaluation of teaching. Ankara: Bizim Büro Press.
Pajares, M.F., 1992. Teachers’ beliefs and educational research: Cleaning up a messy construct. Review of Educational Research, 62(3): 307-332.Available at: https://doi.org/10.3102/00346543062003307.
Pisciottani, F., M.R. Costa, A.E. Figueiredo and C.R. Magalhães, 2019. From theorization about teaching-learning to the practice in nursing continuing education and your contribution to self-efficacy. Research, Society and Development, 8(7): 38871144.
Sahan, H.H. and H. Zöğ, 2017. An analysis of the relation between teacher candidates' attitudes toward the teaching profession and teaching-learning process competencies. Pegem Education and Training Journal, 7(4): 583-610.Available at: https://doi.org/10.14527/pegegog.2017.021.
Schipper, T., S.L. Goei, S. de Vries and K. van Veen, 2018. Developing teachers’ self-efficacy and adaptive teaching behaviour through lesson study. International Journal of Educational Research, 88: 109-120.Available at: https://doi.org/10.1016/j.ijer.2018.01.011.
Schoen, L.G. and S. Wıncour, 1998. An investigation of the self-efficacy of male and female academics. Journal of Vocational Behaviour, 32(3): 307-332.Available at: https://doi.org/10.1016/0001-8791(88)90022-x.
Sencer, M., 1989. Methodology in sociology. Istanbul: Beta Publishing.
Senemoglu, N., 1987. The effect of cognitive input behaviors and feedback correction on access. Unpublished Doctoral Dissertation, Hacettepe University Institute of Educational Sciences, Ankara.
Senemoglu, N., E. Yagci, M. Demirel and T. Ustundag, 2006. Primary school teachers’ self-efficacy levels. In 15th National Congress on Educational Sciences, Muğla University, Turkey.
Shaughnessy, M.F., 2004. An interview with Anita Woolfolk: The educational psychology of teacher efficacy. Educational Psychology Review, 16(2): 153–176.
Simşek, Ö.F., 2007. Introduction to structural equation modeling. Ankara: Ekinoks.
Sonmez, V., 2005. Teacher's handbook in curriculum development. 12th Edn., Ankara: Anı Publishing.
Tabachnick, B.G. and L.S. Fidell, 2001. Using multivariate statistics. 4th Edn., Boston: AlIyn & Bacon.
Tavsancil, E., 2010. Measurement of attitudes and data analysis with SPSS. Ankara: Nobel Publishing.
Tay, L. and A. Jebb, 2017. Scale development. In S. Rogelberg (Ed),The SAGE encyclopedia of industrial and organizational psychology, 2nd Edn. Thousand Oaks, CA: Sage.
Tezbasaran, A.A., 2008. Likert-type scale preparation guide. 3rd Edn. (e-book). Available at: http://www.academia.edu/1288035/Likert_Tipi_Ölçek_Hazırlama_Kılavuzu.
Tschannen-Moran, M. and A.W. Hoy, 2001. Teacher efficacy: Capturing an elusive construct. Teaching and Teacher Education, 17(7): 783-805.Available at: https://doi.org/10.1016/s0742-051x(01)00036-1.
Tschannen-Moran, M., A.W. Hoy and W.K. Hoy, 1998. Teacher efficacy: Its meaning and measure. Review of Educational Research, 68(2): 202-248.Available at: https://doi.org/10.3102/00346543068002202.
Veneziano, L. and J.A. Hooper, 1997. A method for quantifying content validity of health-related questionnaires. American Journal of Health Behavior, 21(1): 67-70.
Woolfolk, A.E. and W.K. Hoy, 1990. Prospective teachers' sense of efficacy and beliefs about control. Journal of Educational Psychology, 82(1): 81-91.Available at: https://doi.org/10.1037/0022-0663.82.1.81.
Xu, L., 2012. The role of teachers' beliefs in the language teaching-learning process. Theory & Practice in Language Studies, 2(7): 1397-1402.
Zhao, J., J. McCormick and K. Hoekman, 2008. Idiocentrism-allocentrism and academics self-efficacy for research in beijing universities. International Journal of Educational Management, 22(2): 168-183.Available at: https://doi.org/10.1108/09513540810853567.
Appendix
Teaching-Learning Process Self-Efficacy Beliefs Scale (TLPSEBS) Items
- I can use supplementary (alternative) evaluation methods.
- I can design appropriate assessment and evaluation types for student features.
- I can determine appropriate teaching activities for the learning outcomes.
- I can edit content according to student interests and needs.
- I can prepare a student-centered lesson plan.
- I can make evaluation in accordance with the course objectives.
- I can determine student-centered learning outcomes.
- I can create the timetable of the course.
- I can use student-centered teaching techniques.
- I can select and use teaching approaches appropriate to the learning outcomes.
- I can identify the necessary techniques to develop a student-centered assessment tool.
- My knowledge of pedagogy is sufficient to organize an effective teaching-learning process.
- I can organize student-centered teaching activities.
- I can choose supplementary resources to be used in teaching activities.
- I can give feedback to students as a result of assessment.
- I can use the most appropriate teaching strategy for the course outcomes.
- I can ensure the active participation of students in the teaching-learning process.
- I can determine the student-centered teaching technique (or techniques) appropriate to the course outcomes.
- I can use student-centered teaching methods.
- I can include activities enabling social development of students.
- I can help students learn by researching.
- I can determine the academic competences of students.
- I can create the environment for students to learn by doing and experience.
- I can determine the method of assessment and evaluation.
- I can design specific assessment and evaluation types for the subject.
- I can choose materials to be used in teaching activities.
- I can determine the student-centered teaching strategy appropriate for the course outcomes.
- I can include activities to ensure the professional development of students.
- I can prepare student-centered educational environments.
- I can organize an effective teaching-learning process through my knowledge of technology.
- I can create student-centered teaching-learning processes.
- I can apply teaching methods and techniques specific to my field in my courses.
- I can organize effective teaching-learning processes by integrating my knowledge of technology, pedagogy and field.
- I can determine the student-centered teaching method(s) appropriate to the course outcomes.
- I can evaluate student development during the course.
- I can determine the cognitive-affective-psychomotor outcomes of the course.
- I can help students make self-evaluation.
- I can develop measurement tools appropriate to students' learning levels.
- I can update the content based on the latest changes.
- I can guide students in achieving the learning outcomes.
Asian Online Journal Publishing Group is not responsible or answerable for any loss, damage or liability, etc. caused in relation to/arising out of the use of the content. Any queries should be directed to the corresponding author of the article. |