Test of Achievement in Quantitative Economics for Secondary Schools: Construction and Validation Using Item Response Theory
1,2Department of Educational Foundations, Faculty of Education, Nnamdi Azikiwe University, Awka, Nigeria
Abstract
A Test to measure achievement in quantitative economics among secondary school students was developed and validated in this study. The test is made up 20 multiple choice test items constructed based on quantitative economics sub-skills. Six research questions guided the study. Preliminary validation was done by two experienced teachers in secondary school economics and one expert in test construction. The pilot testing was conducted to ensure compatibility of the test items while test try-out on 515 students yielded the data for item analysis. Analysis were attained through SPSS and Bilog MG using Item Response Theory (IRT) three-parameter logistic model (3PL) to establish item difficulty, item discrimination, and the guessing value. The empirical reliability of the test was 0.86. The test was found to be of good quality, valid and highly reliable. The test is ready and can now be used to assess students’ achievement in quantitative economics in Nigeria and other countries.
Keywords: Achievement test, Quantitative economics, IRT (Item Response Theory), Uni-dimensionality, Reliability.
1. Introduction
The teaching and learning of economics as a subject in Nigeria and other West African countries is part of the senior secondary- SS1, SS2 and SS3 curriculum (Federal Government of Nigeria, 2004). Economics according to Kallie (2015) is a social science for analyzing the production, distribution, and consumption of goods and services. Economics education is the education provided for economics teachers or would be teachers on different economic issues and problems. It focuses on the improvement of economic curriculum materials and pedagogy. This according to Babalola (2003) is the education provided to assist a rational man in organizing his different thoughts whenever he is faced with day-to-day economic issues and problems.
Thus, economics education is aimed at bringing about desirable behavioral changes in students (Dike, 2002). These behavioral changes are quantified and qualified using achievement tests. Achievement tests are tests given to assess how far a student has learnt what was taught. They are primarily used in making classroom level decisions and are designed with particular reference to the course objectives/learning goals of a specific course, study program or class (Mahajan, 2015). Such tests evaluate students’ understanding of a particular instructional domain in order to make decisions regarding the advancement or knowledge and skill acquired by the students.
Achievement test can be influenced by certain factors. This is supported in a research by Adhanja et al. (2016) and Hanzen (2000) which shows that students’ achievement is affected by different factors such as learning abilities, race, gender, sex and socio-economic factors. On the other hand, Chansarkar and Michaeloudis (2001) explained that students’ achievement is not affected by such factors as age, sex and place of residence but is associated with performance in quantitative skills/subject. They also found out that those who live near school perform better than other students. In support of Chansarkar and Mishaeloudis view, Educational Testing Service (1995) also identified quantitative ability/skill as a factor which could influence students’ achievement in a school subject. Dolado and Morales (2008) specifically pointed out ability in calculations/mathematics as a factor affecting performance in economics.
Quantitative ability is seen as a measure of a student’s ability/skill to apply knowledge of mathematical concepts and principles, to demonstrate flexibility in thinking, to identify critical features on new situations, to make correct generalizations, and to compare mathematical expressions (ETS, 1995; Dolado and Morales, 2008). Quantitative skills involve the ability to solve numerical problems easily. To some people, quantitative ability also means that they are able to separate a whole into its constituent parts more readily than others. It includes arriving at mathematical/calculative solutions to problems, as well as basic adding, subtracting, multiplying and dividing (Adu et al., 2009).
Since the introduction of a new economics syllabus which incorporated some elements of quantitative/calculations into the subject, students’ achievement in economics has not been as good as it has been before. This new syllabus has been a challenge for the economics students in the senior secondary classes partly as a result of the carry over effects of the negative attitudes which they have towards quantitative/calculations (Adu et al., 2009). Consequently, the comments made by West Africa Examination Council (WAEC) Chief examiners tend to portray the impact of quantitative ability on students’ achievement in economics. In West African Examination Council (WAEC) (2010) and WAEC (2012) the chief examiners’ in their reports specifically categorized students’ weaknesses as:
- Calculations- majority of the students/candidates were unable to carry out simple calculations. A question in price elasticity of demand was attempted poorly by very few candidates.
- Poor graph/curve analysis- candidates attempted unsatisfactorily to draw and analyze graphs/curves.
The Chief examiners’ also suggested that students should be encouraged to develop their quantitative skills/ability in economics before the examinations. The need for students to develop their quantitative skills in economics was also emphasized by Osadebe (2014). Osadebe pointed out that a good knowledge in quantitative economics at senior secondary will later help students in tertiary schools to study Economics, Banking, Finance, Accounting and other related courses involving calculations. Hence, there is need for a quality tests of achievement in quantitative economics to enable senior secondary economics teachers’ asses their students’ level of performance/achievement in quantitative economics prior to external examinations. To ensure the quality of the test of achievement in quantitative economics being developed, item analysis of students’ responses to the test items were carried out using Item Response Theory (IRT).
Although Eleje et al. (2016) developed and validated diagnostic economics test on three content areas and Esomonu and Eleje (2017) also developed and validated diagnostic quantitative economics skill test using IRT, these tests were diagnostic tests not achievement test. So, there is lack of test of achievement in quantitative economics for secondary schools to the best of our knowledge. In essence, the construction and validation of test of achievement in quantitative economics has not been researched on, thereby constituting an educational need. The researchers hence deem it necessary to construct and validate test of achievement in quantitative economics for secondary schools using item response theory (IRT).
The objective of this study therefore, is to construct and validate test of achievement in quantitative economics (TAQE) for secondary schools using IRT. Based on the objective stated above, the study sought answers to the following research questions:
1. Is the test unidimensional?
2. Which of the IRT model represents a better fit for the test data?
3. What are the test item threshold levels?
4. What are the test item slope values?
5. What are the test item guessing values?
6. How reliable is the entire test according to IRT model?
2. Literature Review
The literature was reviewed based on the following sub-headings:
Item response theory (IRT)
The a parameter
The b parameter
The c parameter
Quantitative economics skill
Validity of the test
Reliability of the test
2.1. Item Response Theory (IRT)
Thorpe and Favia (2012) describe item response theory (IRT) as a collection of measurement models that try to explain the connection between observed item responses on a scale and an underlying construct. IRT models are mathematical equations that specifically describe the association between subjects’ levels on a latent variable and the probability of a particular response to an item, using a non-linear monotonic function (Hays et al., 2009). As a measurement theory IRT aids to develop an educational measurement scale that has ratio scale, sample independent attributes and students’ ability reported on both item and total instrument levels (Ani, 2014). IRT makes it possible to estimate and interpret item statistics referred to as parameters. In IRT, parameters of the persons are invariant across items, and parameters of the items are invariant in different populations of persons. Thus it brings greater flexibility and provides more sophisticated information which allows for the improvement of the reliability of an assessment (Ani, 2014).
Item parameters in IRT are estimated directly using three logistic models instead of proportions (difficulty or threshold) and item-scale correlations (discrimination) (Adedoyin and Mokobi, 2013). In one-parameter logistic (1PL) model, items are only described by a single parameter in terms of location or difficulty (b) while the slopes (discrimination) are held constant. The two-parameter logistic (2PL) model not only checks for the item difficulty but also assess each item’s level of discrimination between high and low ability students while the three-parameter logistic (3PL) model adds a third item parameter which is called pseudo-guessing parameter that reflects the probability that an examinee with a very low trait level will correctly answer an item solely by guessing. This according to Ani (2014) implies that students can through guessing answer an item correctly in an achievement test.
2.2. The A Parameter
The a parameter is a measure that can be graphically expressed by the steepness of the item characteristic curve (ICC). The a parameter also known as item discrimination (slope) shows how well an item can differentiates among respondents with abilities to the left of the item location from those with abilities to the right of the item location (Thorpe and Favia, 2012). If a parameter value is positive, it implies that students’ of higher ability have a high probability of answering an item correctly and students’ of lower ability have a low probability to answer an item correctly. When a parameter value is negative, it indicates that students’ with high ability have a low probability of answering an item correctly while students’ with low ability have a higher probability of answering an item correctly. A high discrimination value indicates that the item discriminates well among low and high skilled students.
The discrimination values (parameter a-values) of good items according to Adedoyin and Mokobi (2013) ranges from 0.5 to 2. If the values of the item discrimination a is above 1, this is normally desirable value for a good test item. Baker (2001) describes the range and interpretation of values for item discrimination as follows: very low; .01 - .34, Low; .35 - .64, moderate; .65 - 1.34 High; 1.35 - 1.69 and Very high; 1.70 and above.
2.3. The B Parameter
The b parameter also known as item difficulty (threshold), is a location index along the x-axis that tells us how easy or how difficult an item is. The index of an item’s location is the point on the x-axis at which the curve crosses the 0.5 probability value on the y- axis. Negative difficulty estimates indicate that the items are easy while positive difficulty estimates indicate that the items are hard. An easy item functions among the low-ability examinees; a difficult item functions among the high-ability examinees (Baker, 2001; Thorpe and Favia, 2012). The values of b greater than 1 indicate a very difficult item and items with low b values below -1 indicate easy items. When the values of b are between -0.5 and 0.5, then the test items with such difficulty indexes have medium difficulty level.
Baker (2001) pointed out that theoretically, difficulty values can range from - 00 to + 00, in practice, difficulty values usually are in the range of - 3 to + 3. Ceniza and Cereno (2012) gave the interpretation for values of item threshold/difficulty (b-values) as follows: Very Easy = Less than -2, Easy = -0.50 to -2.00, Average = -0.49 to 0.49, Difficult = 0.50 to 2.00 and Very Difficult = Greater than 2.00.
2.4. The C Parameter
The c parameter also known as a pseudo-guessing parameter (Thorpe and Favia, 2012) is the likelihood that an examinee with very low ability can guess the correct response to an item and therefore has a greater-than-zero probability of answering correctly. An examinee who randomly selects responses to items of four options can answer these items correctly about 1 out of 4 times, meaning that the probability of guessing correctly is about 0.25. Harris (1989) concluded that the items with 0.30 or greater c-values are considered not very good, rather c-values of 0.20 or lower are desirable. In like manner, Akindele (2003) also noted that items do not have perfect c-values because examinees do not guess randomly when they do not know the answer.
2.5. Quantitative Economics Skills
Quantitative skills involves the ability to solve numerical problems easily. It entails being able to separate a whole into its constituent parts more readily than others. It includes arriving at mathematical/calculative solutions to problems, as well as basic adding, subtracting, multiplying and dividing (Adu et al., 2009; Riley, 2015). The quantitative skills in secondary economics as listed by Riley (2015) are as follows:
- Calculate, use and understand ratios and fractions
- Calculate, use and understand percentages and percentage changes
- Understand and use the terms mean, median and relevant quartiles
- Construct and interpret a range of standard graphical forms
- Calculate and interpret index numbers
- Calculate cost, revenue and profit (marginal, average, totals)
- Make calculations to convert from money to real terms
- Make calculations of elasticity and interpret the result
- Interpret, apply and analyze information in written, graphical and numerical forms, Riley (2015).
2.6. Validity of the Test
The validity of the test developed using IRT is dependent on the extent to which the students’ responses (data) fit the model or if the model is appropriate for the data. Goodness of fit statistics can be used to test for the model fit to the data. But, -2Log likelihood value is commonly used in Bilog MG to check the goodness of model fit, where higher values indicate a poorer fit of the data to the model. Comparing the values from different models can indicate which model represents a better fit (Thorpe and Favia, 2012; Rijn et al., 2016). The analysis of model fit is a check on internal validity (Obinne, 2013). According to Korashy (1995) if the model fit is acceptable, then the item is valid. However, the smallest -2Log likelihood value is the best (Thorpe and Favia, 2012). Three parameter logistic model was used in this study because it has the lowest -2Log likelihood value.
2.7. Reliability of the Test
Reliability refers to the consistency of a measuring instrument. A test is considered reliable if the same result is approximately gotten repeatedly (Cherry, 2009). Unlike classical test theory that requires another test for reliability, IRT has a local reliability. That is, an amount of information at each point of underlying continuum (Ceniza and Cereno, 2012). With IRT model, each item of the test contained information. For each parameter logistic model, Bilog MG computed an empirical reliability index. A reliability index within the range of 0.81to 1.0 indicates high reliability; 0.61 to 0.80 shows a moderate reliability; 0.41 to 0.60 means fair reliability; 0.10 to 0.40 means slight reliability and less than 0.10 means virtually no reliability.
3. Method
The study is an instrumentation research. It is an instrumentation research since the objective of the study is to construct, validate and produce a valid and reliable test assessing students’ achievement in quantitative economics. The researchers constructed and validated test of achievement in quantitative economics for secondary schools by following these test development stages which are discussed thereafter:
- Planning the test
- Constructing the test
- Initial validation of the test
- Pilot testing
- The test try-out
- Item Analysis
- Selection of good items
3.1. Planning the Test
Planning the test involves identification of the study population, sample and sampling technique, and the test content. A total of 515 students were randomly selected from all the senior secondary three (SS3) economics students in Anambra State in south-east Nigeria as the test try-out sample. The test content area is based on the quantitative sub-skills in secondary economics as given by Riley (2015). Table 2 shows various units of the quantitative economics sub-skills listed along the rows while different educational objectives to be tested were listed along the columns.
Table-1. Economics Achievement Test Table of Specification
| Content | Know |
Com |
Appli |
Interpr |
Total |
| Calculate, Use and Understand Ratios and Fractions | - |
1 |
2 |
- |
3 |
| Calculate, Use and Understand % and % Changes | 1 |
- |
3 |
- |
4 |
| Understand and Use Mean, Median and Relevant Quartiles | 2 |
- |
1 |
- |
3 |
| Construct & Interpret a Range of Standard Graphical Forms | 1 |
2 |
- |
2 |
5 |
| Calculate and Interpret Index Numbers | 1 |
- |
- |
1 |
2 |
| Calculate Cost, Revenue & Profit (Marginal, Average & Totals) | 1 |
- |
1 |
- |
2 |
| Make Calculations to Convert Money to real Terms | - |
- |
2 |
1 |
3 |
| Make Calculations of Elastitcity & Interpret the Result | 2 |
2 |
1 |
1 |
6 |
| Interpret, Apply and Analyze Numerical Forms | 1 |
- |
1 |
- |
2 |
| Total | 9 |
6 |
11 |
5 |
30 |
Abbreviations: Know=Knowledge; Com=Comprehension; Appli=Application; Interpr=Interpretation.
3.2. Constructing the Test
The researchers constructed 30 multiple choice format objective test items that is in line with the table of specifications using economics text books recommended by the Ministry of Education (Anyaele, 2003; Anyanwuocha, 2006). The items of test of achievement in quantitative economics (TAQE) constructed were based on the secondary economics quantitative sub-skills as stipulated by Riley (2015) (see Table 1) and guidelines given by Alderson (2005) and Winarni (2002).
3.3. Initial Validation of the Test
In its initial stage, the 30 items constructed were face and content validated by one expert in educational measurement, evaluation and research, and two experienced secondary economics teachers. Their expert observations, comments and suggestions were used in the modifications of the test.
3.4. Pilot Testing
In its preliminary stage, the 30 items constructed were pilot tested on few SS3 economics students to check grammatical error and compatibility of test of achievement in quantitative economics skill items.
3.5. The Test Try-Out
The test was tried out on 515 SS3 economics students. The test try-out yielded the data for item analysis.
3.6. Item Analysis
The students’ responses to the 30 items of the test of achievement in quantitative economics (TAQE) were subjected to item analysis using Item Response Theory (IRT) to ensure the quality of the items. The items of the test were first checked to determine the dominance of the first factor (uni-dimensionality), secondly assessed for model fit, before IRT psychometric analysis were done to estimate the test items parameters (a, b, c-values) using data from students’ responses. Test for uni-dimensionality in this study was exploratory factor analysis. It is to find out if there exist a dominant trait underlining achievement in quantitative economics assessed by the TAQE. Test for model fit was also assessed by comparing the values of -2Log likelihood from different models to indicate which model represents a better fit for the data. The thirty (30) items of test of achievement in quantitative economics were subjected to IRT psychometric analysis using Bilog MG software to estimate item threshold, slope and asymptote (difficulty, discrimination and guessing) values.
3.7. Selection of Good Items
Items retained in the final output of the test were based on the verbal interpretation of each item as illustrated by Ceniza and Cereno (2012) in Table 2 below. The 20 items that was included in the final output of the TAQE were arranged in-line with the quantitative sub-skills in secondary economics.
Table-2. Decision table of difficulty and discrimination indices
Difficulty Level |
Discrimination Level |
Decision |
Easy |
Low |
Revise |
Moderate |
Retain |
|
High |
Retain |
|
Average |
Low |
Revise |
Moderate |
Retain |
|
High |
Retain |
|
Difficult |
Low |
Revise |
Moderate |
Retain |
|
High |
Retain |
Source: Ceniza and Cereno (2012)
Table-3. Total Variance Explained by the result of factor analysis
| Initial Eigenvalues | |||
Component |
Total |
% of Variance |
Cumulative % |
1 |
7.407 |
24.691 |
24.691 |
2 |
2.359 |
7.863 |
32.554 |
3 |
1.648 |
5.494 |
38.048 |
4 |
1.372 |
4.573 |
42.62 |
5 |
1.24 |
4.132 |
46.752 |
6 |
1.13 |
3.767 |
50.519 |
7 |
1.077 |
3.589 |
54.108 |
8 |
0.997 |
3.323 |
57.43 |
9 |
0.933 |
3.109 |
60.54 |
10 |
0.864 |
2.881 |
63.42 |
11 |
0.814 |
2.713 |
66.133 |
12 |
0.768 |
2.56 |
68.693 |
13 |
0.756 |
2.52 |
71.213 |
14 |
0.731 |
2.437 |
73.65 |
15 |
0.701 |
2.337 |
75.987 |
16 |
0.628 |
2.093 |
78.08 |
17 |
0.607 |
2.024 |
80.103 |
18 |
0.583 |
1.942 |
82.045 |
19 |
0.558 |
1.861 |
83.906 |
20 |
0.53 |
1.765 |
85.671 |
21 |
0.517 |
1.724 |
87.395 |
22 |
0.498 |
1.659 |
89.054 |
23 |
0.487 |
1.622 |
90.677 |
24 |
0.473 |
1.576 |
92.253 |
25 |
0.458 |
1.526 |
93.779 |
26 |
0.412 |
1.372 |
95.151 |
27 |
0.387 |
1.289 |
96.44 |
28 |
0.379 |
1.263 |
97.704 |
29 |
0.368 |
1.227 |
98.931 |
30 |
0.321 |
1.069 |
100 |
Extraction Method: Principal Component Analysis.
4. Results
4.1. Research Question 1
Is the test uni-dimensional?
Table 3 is the result of exploratory factor analysis done on test of achievement in quantitative economics (TAQE) for uni-dimensionality assessment. The result shows that TAQE had six eigen values greater than one and the remaining twenty four values less than one. The first eigen value is 7.407, followed by 2.359, 1.648, 1.372, 1.240, etc.
4.2. Research Question 2
Which of the IRT model represents a better fit for the TAQE data?
Table-4. Model fit information
-2Log likelihood1-PL = 17773.820 |
-2Log likelihood2-PL = 17370.596 |
-2Log likelihood3-PL = 17140.261 |
Source: results from Bilog MG analysis
Three (3) parameter logistic model in Table 4 had the lowest -2Log likelihood.
4.3. Research Questions 3, 4 and 5
What are the item threshold, slope and guessing values/levels of DQEST items based on three parameter logistic (3PL) model?
Table-5. Item threshold (difficulty estimates), slope (discrimination), and asymptote (guessing) values of DQEST items.
Item |
Threshold (Difficulty) |
Difficulty Level |
Slope (Discrimination) |
Discrimination Level |
Asymptote (Guessing) |
Remark |
1 |
0.16 |
Average |
0.21 |
Low |
0.08 |
Revise |
2 |
0.13 |
Average |
0.16 |
Low |
0.06 |
Reject |
3 |
0.12 |
Average |
0.2 |
Low |
0.06 |
Revise |
4 |
0.1 |
Average |
0.2 |
Low |
0.05 |
Revise |
5 |
0.11 |
Average |
0.2 |
Low |
0.05 |
Revise |
6 |
0.12 |
Average |
2.47 |
Very High |
0.02 |
Reject |
7 |
0.06 |
Average |
2.29 |
Very High |
0.02 |
Reject |
8 |
0.47 |
Average |
0.08 |
Low |
0.08 |
Reject |
9 |
0.38 |
Average |
0.07 |
Low |
0.07 |
Reject |
10 |
0.61 |
Difficult |
0.05 |
Low |
0.09 |
Reject |
11 |
0.51 |
Difficult |
0.09 |
Low |
0.07 |
Reject |
12 |
0.08 |
Average |
1.15 |
Moderate |
0.03 |
Retain |
13 |
0.08 |
Average |
1.53 |
High |
0.04 |
Retain |
14 |
0.08 |
Average |
0.24 |
Low |
0.05 |
Revise |
15 |
0.12 |
Average |
2.21 |
Very High |
0.01 |
Reject |
16 |
0.06 |
Average |
1.2 |
Moderate |
0.02 |
Retain |
17 |
0.07 |
Average |
0.35 |
Moderate |
0.04 |
Retain |
18 |
0.06 |
Average |
1.08 |
Moderate |
0.02 |
Retain |
19 |
0.06 |
Average |
2.17 |
Very High |
0.02 |
Revise |
20 |
0.1 |
Average |
0.24 |
Low |
0.05 |
Revise |
21 |
0.09 |
Average |
0.31 |
Low |
0.04 |
Revise |
22 |
0.09 |
Average |
0.25 |
Low |
0.04 |
Revise |
23 |
0.08 |
Average |
2.73 |
Very High |
0.02 |
Reject |
24 |
0.1 |
Average |
2.55 |
Very High |
0.02 |
Reject |
25 |
0.07 |
Average |
0.45 |
Moderate |
0.03 |
Retain |
26 |
0.11 |
Average |
0.46 |
Moderate |
0.04 |
Retain |
27 |
0.07 |
Average |
1.14 |
Moderate |
0.03 |
Retain |
28 |
0.09 |
Average |
0.37 |
Moderate |
0.03 |
Retain |
29 |
0.09 |
Average |
0.91 |
Moderate |
0.03 |
Retain |
30 |
0.06 |
Average |
1.57 |
High |
0.02 |
Retain |
Source: results from DQEST item analysis based on 3pl model
As Table 5 shows, the item threshold (difficulty) and item slope (discrimination) values indicated that eleven (11) items be retained while nine (9) items (1, 3, 4, 5, 14, 19, 20, 21 and 22) be revised. The range of the guessing value were within 0.00 to 0.09.
4.4. Research Question 6
How reliable is the entire test according to IRT model?
Table-6. Summary statistics from item analysis results
N |
515 |
Mean |
-0.009 |
Standard Deviation |
1.012 |
Variance |
0.1407 |
Empirical Reliability |
0.8629 |
Source: results from Bilog MG analysis
The empirical reliability index as given by Bilog MG in the three parameter logistic model is 0.86.
5. Discussion of Findings
The discussion of findings from this study was based on the results gotten from assessment of dimensionality, model fit, item threshold (difficulty), slope (discrimination), guessing, and reliability values of test of achievement in quantitative economics (TAQE).
Table 3 result is the exploratory factor analysis done to assess the test’s dimensionality. The findings from the Table 3 shows that the first seven (7.407, 2.359, 1.648, 1.372, 1.240, 1.130 and 1.077) eigen values were greater than one and the first eigen value which was 7.407 explained 24.691% of the variance in the data set. The rest of the variance was explained by the other 29 eigen values. This is an indication that a dominant component or factor referred to as the ability measured by the test exist among the items (Hambleton et al., 1991). Thus, test of achievement in quantitative economics developed had quantitative economics as a dominant factor. This is supported by Rijn et al. (2016). They pointed out that violation of dimensionality assumption would result in inadequacy of the model in describing the data and hence unreliable estimation of the examinee’s ability and the correct specification of the number of the latent dimensions is directly tied to the construct validity of the test.
As seen in Table 4, -2Log likelihood value for IRT one parameter (1PL), two parameter (2PL) and three parameter (3PL) logistic models were 17773.820, 17370.596 and 17140.261 respectively. 3PL with the lowest -2Log likelihood value represents the model with a better fit for the test items. The essence of using the best model fit for the items according to Thorpe and Favia (2012) is to ensure the validity of the test items. Hence, three parameter logistic (3PL) model was used in this study to estimate the item parameters.
Also, the values of TAQE IRT analysis of item parameters as seen in Table 5 revealed that eleven (11) items be retained, nine (9) items be revised and ten (10) items be rejected. The selection of 11 items retained based on the b-value range of -2 to +2 and a-value range of 0.01 - .34 as Low, 0.35 - 1.34 as moderate, 1.35 - 2.00 as High, 2.01 and above as Very high was in agreement with the criteria description of Baker (2001). The 9 items numbering 1, 3, 4, 5, 14, 19, 20, 21, 22, were modified or revised and then added to the final output of the test. The twenty (20) items that made up the final output of TAQE had a desirable guessing value, that is, the probability of getting the answer correctly by mere guessing was low. The findings of this study are in line with that of Ani (2014) and Adedoyin and Mokobi (2013).
The empirical reliability index of TAQE as seen Table 6 is 0.8629 (approximately 0.86). This indicates 86% certainty of the consistency of the test items in yielding approximately same result repeatedly and that the reliability of test of achievement in quantitative economics (TAQE) developed was high. Thus, the output of this study will provide a valuable instrument in the field of economics education in Nigeria and other countries.
6. Conclusions
The growing interest in the use of IRT is an evidence of the growth in psychometrics, and computer adaptive testing in particular (Embretson and Reise, 2000). According to Hays et al. (2000) IRT has a number of potential advantages over CTT in assessing learning, in developing better measures and in assessing change over time. Its models yield invariant item and latent trait estimates. IRT psychometric methodologies have been used to solve assessment challenges as identified by Aiken (2003) and Cook et al. (2003). Since educational tests are the main source of information about student achievement in schools and in the context of large-scale testing the analysis of test data is essential in determining the quality of the test and the information the test generates. The worth of any educational assessment endeavor depends on the instruments i.e. the tools and techniques used, if these instruments are poorly designed, the assessment can be a waste of time and money (Adedoyin and Mokobi, 2013).
Based on the findings of this study, in terms of results from dimensionality assessment, model fit assessment, values from IRT analysis of Item threshold, slope, guessing, and reliability, the researchers therefore conclude that the test of achievement in quantitative economics developed is uni-dimensional, valid, highly reliable and fair.
Thus, TAQE is of good quality and can now be used for assessment of student’s achievement in quantitative economics. Hence, it is a test instrument that can measure achievement in quantitative economics among secondary schools in Nigeria, and other countries.
7. Recommendations
Based on the findings and conclusions of this study, the researchers’ recommend that the developed test of achievement in quantitative economics (TAQE) be used by the examinees, teachers, school authorities, etc., to assess students’ achievement in secondary school quantitative economics.
References
Adedoyin, O.O. and T. Mokobi, 2013. Using IRT psychometric analysis in examining the quality of junior certificate mathematics multiple choice examination test items. International Journal of Asian Social Science, 3(4): 992-1011. View at Google Scholar
Adhanja, R.A., P.O. Nyakan and J.M.O. Yambo, 2016. Family based socio-economic factors that affect students’ academic performance in public secondry schools in Rongo subcounty, Migori County, Kenya. International Journal of Research and Development Organization, 2(3): 99-12. View at Google Scholar
Adu, E.O., S.A. Ojelabi and A. Hammed, 2009. Quantitative ability as correlates of students’ academic achievement in secondary school economics. An International Multi-Disciplinary Journal Ethiopia, 3(2): 322-333. View at Google Scholar | View at Publisher
Aiken, L.R., 2003. Psychological testing and assessment. 11th Edn., Boston: Allen & Bacon.
Akindele, B.P., 2003. The development of an item bank for selection tests into Nigerian universities: An exploratory study. (Unpublished Doctoral Dissertation). Nigeria: University of Ibadan.
Alderson, J.C., 2005. Diagnosing foreign language proficiency: The interface between learning and assessment. London: Continuum.
Ani, E.N., 2014. Application of item response theory I the development and validation of multiple choice test in economics. (Master’s Thesis). University of Nigeria, Nsukka.
Anyaele, J.U., 2003. Comprehensive economics for senior secondary schools. Kwara: A. Johnson Publishers Limited.
Anyanwuocha, R.A.I., 2006. Fundamentals of economics for senior secondary schools. Owerri: Africana First Publishers Limited.
Babalola, J.B., 2003. Budget preparation and expenditure control in education. In Babalola J.B. (Ed), Basic text in educational planning. Ibadan: Awemark Industrial Printers.
Baker, F.B., 2001. The basics of item response theory. 2nd Edn., United States of America: ERIC Clearinghouse on Assessment and Evaluation.
Ceniza, J.C. and D.C. Cereno, 2012. Development of mathematic diagnostic test for DORSHS. Available from http://www.doscst.edu.ph/index.ph[/academics/graduateschool/publication/category/5-volum-1-issue-1-2012?
Chansarkar, B.A. and A. Michaeloudis, 2001. Student profiles and factors affecting performance. International Journal of Mathematics, Education, Science & Technology, 32(1): 97-104.View at Google Scholar | View at Publisher
Cherry, K., 2009. Reliability – what is reliability? Available from http://psychology.about.com/od/researchmethods/.
Cook, K.F., P.O. Monahan and C.A. McHorney, 2003. Delicate balance between theory and practice: Health status assessment and item response theory. Medical Care, 41(5): 571-571. View at Google Scholar | View at Publisher
Dike, V., 2002. The state of education in Nigeria and the health if the nation. Available from www.africaeconomicanalysis.
Dolado, J.J. and E. Morales, 2008. Which factors determine academic achievement of economics freshers? Some Spanish evidence. Available from www.eco.uc3m.es/temp/dolado/dolado_morales_ie_fv.pdf.
Educational Testing Service, 1995. Comprehensive testing program III technical manual. Princeton, NJ: Author.
Eleje, L.I., N.P.M. Esomonu, N.N. Agu, R.O. Okoye, E. Obasi and F.E. Onah, 2016. Development and validation of diagnostic economics test for secondary schools. World Journal of Education, 6(3): 90-116.View at Google Scholar | View at Publisher
Embretson, S.E. and S.P. Reise, 2000. Item response theory for psychologists. Mahwal, NJ: Erlbaum.
Esomonu, N.P.M. and L.I. Eleje, 2017. Diagnostic quantitative economics skill test for secondary schools: Development and validation using item response theory. Journal of Education and Practice, 8(22): 110-125.
Federal Government of Nigeria, 2004. National policy on education. Lagos: Nigeria Educational Research and Development Council Press.
Hambleton, R.K., H. Swaminathan and H.J. Rogers, 1991. Fundamentals of item response theory. Newbury Park, CA: Sage Publications.
Hanzen, J.B., 2000. Student performance and student growth as measure of success: An evaluator’s perspective. Paper Presented at Annual Meeting of the American Educational Research Association. New Oceans, Louisiana, April 2000.
Harris, D., 1989. Comparison of 1‐, 2‐, and 3‐Parameter IRT Models. Educational Measurement: Issues and Practice, 8(1): 35-41. View at Google Scholar | View at Publisher
Hays, R.D., J.B. Bjorner, D.A. Revicki, K.L. Spritzer and D. Cella, 2009. Development of physical and mental health summary scores from the patient-reported outcomes measurement information system (PROMIS) global items. Quality of Life Research, 18(7): 873–880. View at Google Scholar | View at Publisher
Hays, R.D., L.S. Morales and S.P. Reise, 2000. Item response theory and health outcomes measurement in the 21st century. Medical Care, 38(9): 1128-1142.View at Google Scholar | View at Publisher
Kallie, W., 2015. What is economics? Ddefinition and principles. Study. Available from com/academy/lesson/what-is-economics-definition-principles-quiz.html.
Korashy, A.F., 1995. Applying the rash model to the selection of items for mental ability test. Educational and Psychological Measurement, 55(5): 753-763. View at Google Scholar | View at Publisher
Mahajan, G., 2015. Construction and validation of achievement test in economics. International Journal of Humanities and Social Sciences Studies, 1(6): 54-60.View at Google Scholar
Obinne, A.D.E., 2013. Test item validity: item response theory (IRT) perspective for Nigeria. Research Journal in Organizational Psychology and Educational Studies, 2(1): 1-6. View at Google Scholar
Osadebe, P.U., 2014. Construction of economics achievement test for assessment of students. World Journal of Education, 4(2): 58-64. View at Google Scholar | View at Publisher
Rijn, R.W., S. Sinharay, S.J. Haberman and M.S. Johnson, 2016. Assessment of fit of item response theory models used in large-scale educational survey assessments. Large-scale Assessments in Education, 4(1): 1-23. View at Google Scholar | View at Publisher
Riley, J., 2015. Teaching the new a level economics: Mastering quantitative methods. Available from http/beta.tutor2u.net/economics/…/teaching-the-new-a-level-economics-mastering.
Thorpe, G.L. and A. Favia, 2012. Data analysis using item response theory methodology: An introduction to selected programs and applications. Psychology Faculty Scholarship: 1-34.
WAEC, 2012. Chief examiners’ report.
West African Examination Council (WAEC), 2010. Chief examiners’ report. Available from https://lifemagnanimous.files.wordpress.com/2013/06/chief-examiners-report-report-for-the-dec-2010-lshsce.pdf.
Winarni, I., 2002. The development of a diagnostic reading test of english for the students of medical faculty. Malang: Brawijaya University.
Appendix A
Test of Achievement in Quantitative Economics (TAQE) for Secondary Schools
If the demand and supply equations for commodity X are represented by
D = 10–1/3p; S = 9-1/4p.
1. Determine the equilibrium quantity for commodity X.
(a) 12 (b) 4 (c) 10 (d) 6
Age distribution table of a State
Age |
0–16 |
17-35 |
36-65 |
66 and above |
Population |
15000 |
10000 |
20000 |
5000 |
2. The ratio above indicates ____ dependency ratio.
(a) low (b) high (c) equal (d) constant
Use the following demand schedule to answer question 3.
Price in Naira |
Quantity Demanded |
Old New |
Old New |
25 35 |
100 80 |
3. Determine the percentage change in quantity demanded
(a) 40% (b) 30% (c) 20% (d) 10%
The population of 380 SS2 students in four schools is represented in percentages by the pie chart below.
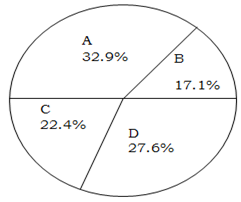
4. Generate the population of school D
(a) 100 (b) 95 (c) 115 (d) 105
The population of five towns in Anambra State is shown below.
Town |
Population |
1 |
50 |
2 |
35 |
3 |
65 |
4 |
20 |
5 |
80 |
5. The percentage population of town 3 above is _______
(a) 20% (b) 26% (c) 36% (d) 30%
Find the mean and median quantity of litres of fuel sold, using the frequency table below.
Number of Litres sold |
Frequency |
1 |
5 |
2 |
4 |
3 |
10 |
4 |
8 |
5 |
6 |
6 |
3 |
6. The mean quantity of the frequency table is ______
(a) 2.4 (b) 3.4 (c) 3.1 (d) 2.9
7. Calculate the lower quatile of the distribution above
(a) 3 (b) 1 (c) 2 (d) 4
Individual demand schedule for coke bought by Mrs Ebo is shown below.
Price per bottle N |
Total quantity bought Per week |
100 |
6 |
90 |
10 |
80 |
15 |
70 |
20 |
60 |
25 |
50 |
30 |
8. The curve of Mrs Ebo’s demand schedule has _____ slope.
(a) lower (b) higher
(c) nagative (d) positive
Use the diagram below to answer questions 12 and 13
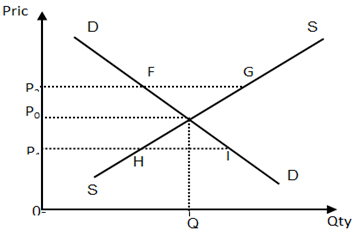
9. At 0P2, FG illustrates _______
(a)excess demand
(b)quantity supplied
(c)equilibrium quantity
(d) excess supply
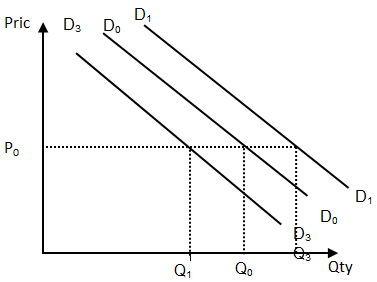
10. D1D1 in the diagram above implies
(a) increase in demand
(b) decrease in demand
(c) increase in quantity demanded
(d) decrease in quantity demanded
11. If the price of a litre of fuel was N50 in 2016 but rose to N80 in 2017, the index number will be
(a) 150 (b) 140 (c) 160 (d) 175
12. The answer above justifies that the value of money
(a)fell by 62.5% (b) fell by 61.5% (c)rise by 62.5% (d) rise by 61.5%
Use the table below to answer questions 14 and 15.
Output of |
Total |
Marginal |
Total |
Marginal |
rice (kg) |
revenue N |
revenue N |
cost N |
cost N |
10 |
150 |
- |
250 |
- |
20 |
200 |
5 |
300 |
5 |
30 |
350 |
15 |
430 |
13 |
40 |
450 |
F |
500 |
7 |
50 |
550 |
10 |
550 |
M |
60 |
600 |
5 |
580 |
3 |
70 |
630 |
X |
700 |
12 |
13. Find the values of X and M
(a)5 and 5 (b) 7 and 3
(c) 10 and 5 (d) 3 and 5
14. What will be the profit maximising output of this firm?
(a) 10 (b) 30 (c) 50 (d) 70
A country produced 12 tons of goods at 2005 market price and in 2010 the country’s output remains 12tons, assuming the price rose by 50% in 2010. Using 2005 as the base year, 15. Calculate the price index for 2010
(a) 150 (b)100(c) 120(d) 200
16. Calculate the norminal value of the output in 2005 and 2010
(a) N1200 and N1500
(b) N1200 and N1200
(c) N1000 and N1200
(d) N1000 and N1500
17. Derive the real value of the output in 2010
(a)N1800 (b) N1200
(c) N1000 (d) N1500
If the weekly income of a consumer increased from N15 to N20, and quantity of goods bought per week increased from 10 to 15.
18. The income elasticity of demand for this consumer is ________ demand.
(a) inelastic (b) elastic
(c) unitary elastic (d) zero elastic
If the price of commodity Y increased from 30k to 35k per unit and the quantity of another commodity X bought increased from 120 to 150.
19. The demand for commodity X is ___________demand.
(a) elastic (b) inelastic
(c) unitary elastic (d) fairly inelastic
Use the table below to answer question 29 and 30
Item |
N million |
Final consumption expenditure |
500 |
Gross private investment |
150 |
Government purchases |
300 |
Depreciation |
25 |
Net factor income |
-10 |
20. The net capital formation is
(a) N115m (b) N125m
(c) N915m (d) N925m
Appendix B
Test of Achievement in Quantitative Economic (TAQE) Answer (key) for Twenty (20) Multiple Choice Test Items
ITEM |
KEY |
ITEM |
KEY |
||
NEW |
OLD |
NEW |
OLD |
||
1 |
1 |
D |
11 |
19 |
C |
2 |
3 |
A |
12 |
20 |
A |
3 |
4 |
A |
13 |
21 |
D |
4 |
5 |
D |
14 |
22 |
C |
5 |
12 |
B |
15 |
25 |
A |
6 |
13 |
B |
16 |
26 |
A |
7 |
14 |
C |
17 |
27 |
B |
8 |
16 |
C |
18 |
28 |
B |
9 |
17 |
D |
19 |
29 |
A |
10 |
18 |
A |
20 |
30 |
C |