A Study on the Relationship between the Performance Characteristics and the Body Mass Index of 8-10 Year-Old Children
Karadeniz Technical University, Physical Education And Sports High School, Trabzon, Turkey
Abstract
The study was carried out to discover the relationship between the performance characteristics (20 m. running, vertical jump, standing long jump, ball throwing, shuttle run) and the body mass index of 8-10 year-old school children. 3772 children (1995 male and 1777 female) aged 8-10 from Ankara participated in the study voluntarily. To measure the height of the children a stadiometer with ± 1mm graduation (Holtain, UK) and to measure their weight a stand art medical scale with ± 0.1kg readability were used. After the height and weight measurements, body mass indexes (BMI) of the children were calculated. Then, 20 m. running, vertical jump, standing long jump, ball throwing, shuttle run tests were applied to the children. To compare the mean values and to determine the differences between the groups T Test was applied and statistical correlation analysis was done to study the relationship between the Body Mass Index (BMI) and the Performance Characteristics(20 m. running, vertical jump, standing long jump, ball throwing, shuttle run). A statistically meaningful difference was defined between the female and the male participants when their mean points in body weight and height, body mass index, vertical jump, standing long jump, 20 m. run, ball throwing, and shuttle run(p<0.05) compared. In this comparison, while the average points of the male children in body weight and height, body mass index, vertical jump, standing long jump, ball throwing, and shuttle run were higher, their average points in 20 m. run were lower than the female children. It was observed that there was a relationship at a meaningful level and with a negative tendency between the points of body mass index of the male and female children and their vertical jump(r=-0.046, p<0.01), and standing long jump(r=-0.046, p<0.01) and shuttle run points(r= -0.229, p< 0.01). As to the relationship between the body mass index and 20 m run(r= 0.094, p< 0.01) and ball throwing (r= 0.286, p< 0.01), it was meaningful with a positive tendency. In our study, it was determined that the male children had better results than the female children according to the test results related to the physical characteristics and performance measurements. It has been concluded that the differences found stem from the gender difference and depending upon the environmental and cultural factors at these ages, the male children are thought to have a better development in terms of performance characteristics.
Keywords: Performance test.
1. Introduction
It has been known that the participation in sports and physical activities in childhood period is important for improvement in general public health (Hekim, 2014). Having a sporting habit in childhood period minimizes the probable future physical, metobolical and functional health risks (Taşkınöz, 2011). For that reason, in the studies it has been emphasised that the necessary precautions should be taken to increase the physical activity levels of children both at school and after School (Şimşek et al., 2005; Ağca and Koçoğlu, 2010; Beşikci, 2010; Altunkan, 2013).
It has been seen that today’s children are physically less active and heavier and have more skinfold thicknesses than the children of our childhood period. When the reasons are considered sedentary apartment living, inadequate number of playgrounds, easy commuting, parents motivating their children play at home because of controlling them more easily, children’s spending their time in front of TV and on computers especially after classes during the school year are the first to come up (Özer and Özer, 2004).
In addition to sedentary living style of children, the increase in the irregular fast food consumption habit causes to many health problems. It has been known that when sports, physical activity and exercise program are applied to the children along with diet, it decreases many health problems.
Beside being a physical problem and having a negative effect on motor skills and performance, fatness in children stemming from especially sedentary lifestyle and unbalanced dieting is also considered as a psychological problem.
Since all these medical, psychological, social and physical problems mentioned above are known, encouraging children to have a sporting habit and a physically active life style at early ages is significant in terms of creating a healthy society in future. Concerning this matter, in our study the relationship between body mass index and sportive performance-determinants in healthy and active life- of children is aimed to study.
2. Method
3772 children (1995 male and 1777 female) aged 8-10 from Ankara participated in the study voluntarily.In our study body height and weight measurements were taken and vertical jump, standing long jump, 20 m speed run, ball throwing and shuttle run tests were applied.
3. Data Collection
Body Height and Body Weight: To measure the height of the children a stadiometer with ± 1mm graduation (Holtain, UK) was used. Body height measurements were taken in “cm” after the participants took anatomic position barefoot and heels touching each other and held their breath.To measure body weight, a stand art medical scale with ± 0.1kg readability was used. The body weight measurements of the particapants were taken in “kg” while they were barefoot in anatomic position in shorts and t-shirts(Lohman et al., 1988) .
3.1. Body Mass İndex (BMI)
After the body height and weight measurements of the children had been taken, BMI (Body Mass Index) were calculated using the following formula.
BMI= Body Weight (kg) / Body Height (m)2 (Bulgan and Başar, 2018)
3.2. Vertical Jump Test
Vertical jump test; the athlete tried to jump as high as possible in front of a platform on the wall. Before the test, standing reach height of the athlete was measured. After the test the difference between the standing reach height and jump height was calculated and vertical jump distance was recorded in cm. The athletes were tested twice and the best scores were recorded (Sevim, 1997).
3.3. Standing Long Jump
After the long jump done using two foot take off and two legs coordinated, the distance between the start line and the last track of the athlete was measured in cm. The athletes were tested twice and the best scores were recorded (Sevim, 1997).
3.4. 20 m Speed Run Test
The children ran a maximum sprint on a 20 m limited track. The running time was recorded in seconds using a stopwatch. Two trials were given and the best time was recorded (Sevim, 1997).
3.5. Ball Throwing Test
The line where the children would throw the ball is marked the children are given the instructions related to the test. All the arrangments are done fully. The children take their place at the line, medicine ball held by two hands is brought to the back of the head. After bending the body slightly backward, the ball is released at the furthest distance above the head by flinging the arms forward. The athlete is tested twice after a two-minute interval and the best result is recorded (Sevim, 1997).
3.6. 20 m Shuttle Run Test
It is a 20 m distance shuttle run test. The running speed is controlled using a tape recorder giving signals or beeping at certain intervals. Test is ended when the athlete could not catch the signal twice or quits the test (Sevim, 1997).
3.7. Statistical Analysis
Independent Samples T Test was used to compare the mean values of the groups and determine the difference, and Correlation Statistical Analysis was used to study the relationship between performance characteristics (20 m speed run, vertical jump, standing long jump, ball throwing and shuttle run ) and Body Mass Index (BMI). SPSS 22 program eas used assess the data collected.
4. Findings
Table-1. Min.-Max. In Terms Of Gender- Mean Values and T Test Results
| Gender | N | Min. | Max. | O | SS | t | p | |
| Body Weight(Kg) | Female | 1777 | 15,00 | 83,00 | 29,56 | 6,45 | -5,113 | 0,00* |
| Male | 1995 | 16,00 | 71,00 | 30,67 | 6,90 | |||
| Body Height (cm) | Female | 1777 | 109,00 | 159,00 | 131,86 | 6,32 | -5,721 | 0,00* |
| Male | 1995 | 104,00 | 156,00 | 133,01 | 5,99 | |||
| Body Mass Index (kg\m2) | Female | 1777 | 10,81 | 40,59 | 16,88 | 2,76 | -3,578 | 0,00* |
| Male | 1995 | 9,40 | 32,86 | 17,21 | 2,99 | |||
| Vertical Jump (cm) | Female | 1777 | 11,00 | 38,00 | 17,27 | 4,09 | -4,989 | 0,00* |
| Male | 1995 | 9,00 | 40,00 | 18,03 | 5,28 | |||
| Standing Long Jump (cm) | Female | 1777 | 30,00 | 165,00 | 94,72 | 16,83 | -23,089 | 0,00* |
| Male | 1995 | 30,00 | 210,00 | 108,14 | 18,86 | |||
| 20 m. Run (sec.) | Female | 1777 | 3,80 | 7,74 | 4,76 | ,47 | 11,479 | 0,00* |
| Male | 1995 | 3,26 | 4,10 | 4,47 | ,94 | |||
| Ball Throwing (cm) | Female | 1777 | 11,00 | 186,00 | 78,16 | 23,39 | -17,020 | 0,00* |
| Male | 1995 | 10,00 | 233,00 | 92,60 | 28,66 | |||
| Shuttle Run (number) | Female | 1777 | 6,00 | 49,00 | 19,19 | 7,37 | -19,673 | 0,00* |
| Male | 1995 | 3,00 | 79,00 | 25,13 | 10,99 |
*P<0,05
A meaningful difference was found between the mean body weight points depending upon the gender of the children; the mean body weight value of the male children (Mean= 30.67, SD=6.90) was higher (t= -5.113, p<0.05, Table 1) than the mean body weight value of the female children (Mean= 29.56, SD=6.45).
A meaningful difference was found between the mean body height points depending upon the gender of the children; the mean body height value of the male children (Mean= 133.01, SD=5.99) was higher (t= -5.721, p<0.05, Table 1) than the mean body height value of the female children (Mean= 131.86, SD=6.32).
A meaningful difference was found between the mean body mass index points depending upon the gender of the children; the mean body mass index value of the male children (Mean= 17.21, SD=2.99) was higher (t= -3.578, p<0.05, Table 1) than the mean body mass index value of the female children (Mean= 16.88, SD=2.76).
A meaningful difference was found between the mean vertical jump points depending upon the gender of the children; the mean vertical jump value of the male children (Mean= 18.03, SD=5.28) was higher (t= -4.989, p<0.05, Table 1) than the mean vertical jump value of the female children (Mean= 17.27, SD=4.09).
A meaningful difference was found between the mean long jump points depending upon the gender of the children; the mean long jump value of the male children (Mean= 108.14, SD=18.86) was higher (t= -23.089, p<0.05, Table 1) than the mean long jump value of the female children (Mean= 94.72, SD=16.83).
A meaningful difference was found between the mean 20 m run points depending upon the gender of the children; the mean 20 m run value of the male children (Mean= 4.47, SD=0.94) was lower (t= 11.479, p<0.05, Table 1) than the mean 20 m run value of the female children (Mean= 4.76, SS=0.47).
A meaningful difference was found between the mean shuttle run points depending upon the gender of the children; the mean shuttle run value of the male children (Mean= 25.13, SD=10.99) was higher (t= -19.673, p<0.05, Table 1) than the mean shuttle run value of the female children (Mean= 19.19, SD=7.37).
Tablo-2.The Relationship between Body Mass Index and Performance Values of the Female Children
| Vertical Jump (cm) | Long Jump (cm) | 20 m. Run (sec) | Ball Throwing (cm) | Shuttle Run(number) | ||
| Body Mass Index (kg\m2) | r | -,015 | -,075 | ,108 | ,263 | -,225 |
| p | 0,518 | 0,001** | 0,000** | 0,000** | 0,000** | |
| N | 1777 | 1777 | 1777 | 1777 | 1777 | |
**p<0,01
It was found out that there was statistically no significant difference with negative tendency between the body mass index and the vertical jump points of the female children (r= -0.015, p> 0.05). While a relationship with a negative tendency between the body mass index and long jump (r= -0.075, p<0.01) and shuttle run points (r=-0.225, p<0.01) was observed, a relationship with a positive tendency was noticed between the body mass index and 20 run (r= 0.108, p<0.01) and ball throwing points (r=0.263, p<0.01).
Table-3.The Relationship Between Body Mass Index and Performance Values of the Male Children
| Vertical Jump (cm) | Long Jump (cm) | 20 m. Run (sec) | Ball Throwing (cm) | Shuttle Run (number) | ||
| Body Mass Index | r | -,074 | -,175 | ,112 | ,295 | -,281 |
| p | 0,001** | 0,000** | 0,000** | 0,000** | 0,000** | |
| N | 1995 | 1995 | 1995 | 1995 | 1995 | |
**p<0,01
A meaningful relationship with a negative tendency between the body mass index points of the male children and their vertical jump (r= -0.074, p<0.01), long jump (r= -0.175, p< 0.01) and shuttle run points (r= -0.281, p< 0.01) was found. A meaningful relationship with positive tendency was determined between their body mass index points and 20 m run (r= 0.112, p< 0.01) and ball throwing points (r= 0.295, p< 0.01)
Table-4.The Relationship Between Body Mass Index and Performance Values of the Male and Female Children
| Vertical Jump (cm) | Long Jump (cm) | 20 m. Run (sec) | Ball Throwing (cm) | Shuttle Run (number) | ||
| Body Mass Index | r | -,046 | -,104 | ,094 | ,286 | -,229 |
| p | 0,005** | 0,000** | 0,000** | 0,000** | 0,000** | |
| N | 3772 | 3772 | 3772 | 3772 | 3772 | |
**p<0,01
It was found out that there was a meaningful relationship with a negative tendency between the body index points of the male and female children and their vertical jump (r=-0.046, p<0.01),long jump (r= -0.104, p< 0.01) and shuttle run points (r= -0.229, p< 0.01). As to the relationship between the body mass index points and 20 m run (r= 0.094, p< 0.01) and ball throwing points (r= 0.286, p< 0.01), it was meaningful with a positive tendency.
BMI dispersions of the female and male children are shown in Graphic 1 and Graphic 2.
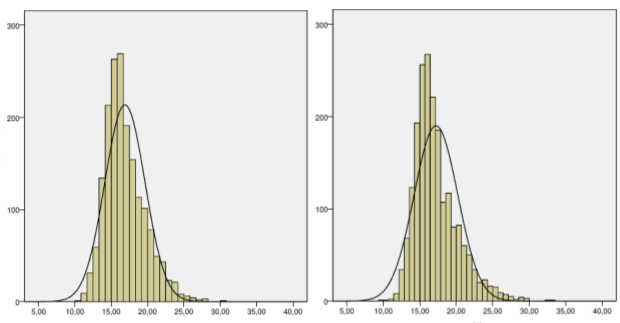
Graphic-1. Dispersion of the BMI of the Female Children Graphic-2. Dispersion of the BMI of the Male Children
5. Dıscussıon and Result
Today, sport might be accepted as one of the fundamental elements of a healthy and a balanced life and also one of the most useful social activities. Especially sportive activities done during childhood period have an important role in the development and preservation of a healthy physical structure. Regular sporting has a great importance in a child’s healthy and balanced development. Every child should be engaged in a certain physical activity in order to have a healthy growth and development (Açıkada and Ergen, 1990). In addition, the acquisition of sports consciousness during childhood and the increase of physical activity together with sports education in the school environment is an important factor in achieving a healthier structure for children.
In our study, the mean measurements of body weight and height were found as 29.56±6.45 kg, 131.86±6.32 cm for female and 30.67±6.90 kg, 133.01±5.99 cm for male children and a statistically meaningful difference was found(p<0.05).
In the study on the health and performance profiles of the athletes at training centers, the mean values of the body height and weight of the 9 year-old female and male athletes were found as 27.26±4.03 kg, 129.77±4.70 cm and 24.13±1.82 kg, 125.55±3.32 cm consecutively (Beşikci, 2010). Polat, Y at al in their study on assessment of physical fitness of footballer children found body weight and height mean values of 9 year old female and male athletes as 27.26±4.03 kg, 129.77±4.70 cm(females) and 24.13±1.82 kg, 125.55±3.32 cm (males)(Yahya et al., 2003). Their study results are not similar to our findings.
In our study, the mean measurements of the body mass index were found as 16.88±2.76 for female and 17.21±2.99 for male children and a statistically meaningful difference was found between the measurements (p<0.05).
Dursun GÜLER at all in their study- the Assessment of 8-10 Year-Old Female Turkish Children’s Physical Fitness Related To Health and the Norms- found body mass index measurement as 17,36 ±2,46 for 9 year-old female children (Güler et al., 2007). Aksel ÇELİK at all in their study –the assessment of physical and motoric characteristics of 7-9 year old secondary school students- found body mass index measurement of 9 year old females as 16.51±2.44 and as 17.65±2.64 for males (Aksel et al., 2013). Their study results are similar to our findings.
In our study, the mean measurements of vertical jump were found as 17.27±4.09 cm for female and 18.03±5.28 cm for male children and a statistically meaningful difference was found between the measurements (p<0.05).
Polat, Y at al in their study on assessment of physical fitness of footballer children found vertical jump mean measurement values of 9 year old male athletes as 26.58±4.62 cm (Yahya et al., 2003). Ömer ALICI at all in their study- A comparison of some parameters of 13-15 aged wrestlers, handballers, and children with a sedentary lifestyle-found vertical jump mean value of the participants with sedantarybehaviour as 36.00±4.98 cm (Ömer and Rüçhan, 2015). Their study results are not similar to our findings.
In our study, the mean measurements of standing long jump were found as 94.72±16.83 cm for female and 108.14±18.68 cm for male children and a statistically meaningful difference was found between the measurements (p<0.05).
AyşegülEvren at al in their study- A comparison of physical characteristics of 7-8 aged female gymnastic athletes and the same aged females not participating in sport activities- found standing long jump mean value as 122±0.12 cm (Ayşegül and Sürhat, 2005). HacıAhmet PEKEL at all in their study-the assesment of the physical fitness test results of the children engaged in athletics and some anthropometric characteristics- found the mean standing long jump measurements found as 163.2±9.4 cm for 10 year old females and 171.3±17.3 cm for 10 year old males (Haci et al., 2007). Their study results are not similar to our findings.
In our study, the mean measurements of 20m run were found as 4.76±0.47 sec for female and 4.47±0.94 sec for male children and a statistically meaningful difference was found between the measurements (p<0.05).
Gamze ERİKOĞLU at all in their study- the assesment of performance parameters with eurofit test battery according to gender and age groups at 7-12 year old children- found 20 m sprint test mean values as 4.78±0.6 sec. for females and 5.94±7.4 sec for males (Gamze et al., 2009). HacıAhmet PEKEL at all in their study-the assesment of the physical fitness test results of the children engaged in athletics and some anthropometric characteristics- found 20 m sprint test mean values as5.34±0.06 sec. for 10 year old females and 5.15±0.22 for 10 year old males (Haci et al., 2007). Their study results are not similar to our findings.
In our study, the mean measurements of ball throwing test were found as 78.16±23.39 cm for female and 92.60±28.66 cm for male children and a statistically meaningful difference was found between the measurements (p<0.05).
Arabacı, R at all in their study found mean ball throwing test value found as 5.33±0.94 m for 9-10 year-old females and 5,66±1,12 m for 9-10 year-old males (Arabacı et al., 2008). Gül at all, in their study on 10-12 year old male children, found mean ball throwing value as 5,07±0,92 m for subject group and 6,14±1,25 m for control group (Gül et al., 2006). Their study results are not similar to our findings.
In our study, the mean measurements of shuttle run test were found as (n=1776) 19.19±7.37 times for female and 25.13±10.99 times for male children and a statistically meaningful difference was found between the measurements (p<0.05).
Gamze ERİKOĞLU at all in their study- the assesment of performance parameters with eurofit test battery according to gender and age groups at 7-12 year old children- found shuttle run test mean values as 27.5±5.40 times for females and 33.28±5.38 times for males (Gamze et al., 2009). In the study on the health and performance profiles of the athletes at training centers, shuttle run test mean values of the 9 year-old children were found as 46.89±4.78 times for females and 37.71±6.26 for male athletes (T.C Prime Ministry Directorate General of Youth and Sports Directorate of Health Affairs, 2010). Their study results are not similar to our findings.
The best explanation for the gender difference at motor performance is “social and cultural differences”(Özer and Özer, 2004).
As a conclusion, in our study, it was determined that the male children had better results than the female children according to the test results related to the physical characteristics and performance measurements. It is concluded that the differences found stem from the gender factor and the male children have a better development in terms of performance characteristics due to the environmental and cultural factors at these ages.
References
Açıkada, C. and E. Ergen, 1990. Science and sports. 1st Edn., Ankara: Büro Tek Offset Printing.
Ağca, Ö. and G. Koçoğlu, 2010. The effects of regular exercising on the body compositon of the overweight and obese adolescent females. Dirim Medicine Journal, 85(1): 17-23.
Aksel, Ç., G. Erkan and A. Funda, 2013. The evaluatıon of physıcal and motorıc propertıes of elementary students ages 7-9. DEU, Journal of Faculty of Medicine, 27(1): 7-13. View at Google Scholar
Altunkan, H., 2013. The prevalence of obesity in children ages 6-19 in Karaman City, Turkey. Journal of Medicinal Researches, 11(1): 6-11.
Arabacı, R., Ş. Koparan, F. Öztürk and M. Akın, 2008. Examınıng the Iı. Level results of the talent selectıon in sports and dırectıng to sports project for the olympıc games (Bursa Sample). E-Journal of New World Sciences Academy Health Sciences, 3(2): 86-98.
Ayşegül, E. and M. Sürhat, 2005. Comparısons of some physıcal features of 7-8 age group gırls whıch attend to rhythmıc gym sport and whıch don’t. Journal of Physical Education and Sport Sciences, 10(3): 39–50.
Beşikci, A.O., 2010. Obesity at early ages:Causes and prevention. Mised, 23(24): 82-85.
Bulgan, Ç. and M.S. Başar, 2018. Functional testing in human performance. İstanbul: İstanbul Tıp Kitapevleri.
Gamze, E., O. Huseyin, G. Nasrin, S. Ceren, T. Tuğçe, Ş. Neşe, S. Ziya, Z. Erdal and A.F. Nevin, 2009. The assesment of performance parameters with eurofit test battery according to gender and age groups at 7-12 year old children. Journal of Physical Education and Sport Sciences, 14(4): 49-64.
Gül, G.K., E. Seyrek and M. Sugurtin, 2006. A comparison of some anthropometric and motoric aspects of 10-12 aged athletics trainees and non-trainees, 9. International Sport Sciences Congress, Muğla.
Güler, D., Ş.S. Balcı, F. Çolakoğlu and S. Karacan, 2007. The evaluation and norms of health-related physical fitness norms of 8 To 10 year-old Turkish girls. Mehmet Akif Ersoy University Journal of Education Faculty, 16: 65-75. View at Google Scholar
Haci, A.P., S.B. Sukru, A. Ozlem, B. Emre, A. Latif, T. Kemal, P. Hamdi and K. Yaprak, 2007. The assesment of the physical fitness test results of the children engaged in athletics and some anthropometric characteristics. Kastamonu Journal of Education, 15(1): 427-438.
Hekim, M., 2014. Health problems caused by sedentary living style – a global problem- and the importance of physical activity İn prevention of the health problems caused by sedentary living style, 2. Internatıonal Davraz Congress. Proceedıngs Book. Isparta. S. 2363-2371.
Lohman, T.G., A.F. Roche and R. Marorell, 1988. Anthropometric standardization reference manual. Champaign: IL: Human Kinetics Books.
Ömer, A. and İ. Rüçhan, 2015. A comparison of some parameters of 13-15 aged wrestlers, handballers, and children with a sedentary lifestyle. International Journal of Human Sciences, 12(1): 1070-1081. View at Publisher
Özer, D.S. and M.K. Özer, 2004. Motor development in children. İstanbul: Kazancı Kitap Tic. Aş.
Sevim, Y., 1997. Training science. Ankara: Tutibay Ltd.Şti.
Şimşek, F., U. Betül, B. Merih, B.G. Sevgi, A. Pelin and Ö. Gönül, 2005. Obesity frequency at a secondary school and Lycee’ in Ankara, Ankara University. Journal of Medicine Faculty, 58: 163-166.
T.C Prime Ministry Directorate General of Youth and Sports Directorate of Health Affairs, 2010. The health and performance profiles of the athletes at training centers, Ankara.
Taşkınöz, C., 2011. A study on physical activity level of 9-11 year-old secondary school pupils in terms of age and gender. Unpublished Master's Thesis, Muğla Sıtkı Koçman University Social Sciences Institute.
Yahya, P., Ç. Vedat, Ş. Mustafa and Y. Rahmi, 2003. The assessment of physical fitness of footballer children. IU Journal of Sports Sciences, 11(3): 196-199.