Reliability and Validity of Fear of Happiness Scale: A Case Study of University Students
Konya Necmettin Erbakan University, Guidance and counseling department, Turkey
Abstract
The aim of this study is to determine whether the Happiness Fear Scale (FHS) developed by Joshanloo and Weijers (2014) is suitable for Turkish culture. For this purpose, validity and reliability of the scale were examined. The study consisted of 180 university students, 87 male and 23 female. The linguistic equivalence of the scale was made by translators and experts in psychological counseling and guidance. Exploratory Factor Analysis, Similar Scale Validity, Cronbach Alpha Internal Consistency and Confirmatory Factor Analysis were used in the analysis of the factor analysis of the scale. The scale presents a one-dimensional structure and accounts for 65% of the total variance. The item total correlation scores ranged from .60 to .72. The one-dimensional structure of the scale was well matched by the model (RMSEA = .06, AGFI = 0.92, NFI = .98, GFI = 0.9, CFI = 0.99, IFI = 0.99, RFI = .95, and SRMR = .03). The internal consistency coefficient was found .86. From here it is possible to say that this scale is a reliable and valid measuring instrument suitable for Turkish culture.
Keywords:Fear of happiness, Happiness, Scale, Validity, Reliability.
1. Introduction
In recent years, the need to investigate the positive feelings and behaviors of psychology has led to the emergence of the field positive psychology. Positive psychology addresses emotional factors such as motivation, achievement, optimism, hope, and subjective well-being that affect the healthy aspects and strengths of the individual rather than the negative aspects of the individual. Positive psychology emphasizes the concept of happiness. Happiness, in other words subjective well-being (Diener, 2000; Kangal, 2013) refers to the subjective evaluation of the person in terms of cognitive and emotional and judicial reporting (Myers and Deiner, 1995). According to Vaillant (2003) happiness represents the positive side of mental health. Diener (1984) defines happiness as having as little and positive emotions as possible as negative emotions, and relates happiness closely to life satisfaction. Lyubomirsky (2007) expressed happiness, as well-being, joy and life satisfaction. Sapmaz and Doğan (2012) stated that the concept of happiness is the ultimate goal of humankind, while Joshanloo and Weijers (2014) believed that that the concept of happiness is only an ultimate goal in western societies and Joshanloo (2013a) noted that these results can not be generalized to Islamic countries
The concept of happiness has a three-dimensional structure. These are; life satisfaction, negative affect and positive affect dimensions (Diener, 1984; Myers and Deiner, 1995).
The meanings of the concepts of life assessment and jurisdiction are largely related (Diener, 2000; Kangal, 2013). Life assessment basically involves a number of variables such as positive emotions like pleasure and enjoyment; cognitive judgments such as life satisfaction and negative emotions such as depression and pain (Argyle et al., 1989; Ben-Zur, 2003; Dogan and Eryılmaz, 2013) . In this definition, life satisfaction constitutes the cognitive dimension of happiness. Life satisfaction, which is the cognitive dimension of happiness, shows how individuals perceive their own experiences when they evaluate all their experiences. When the person is assessing whether he is happy or not, he will judged depending on the frequency of the joyfull experiences and negative situations like emotions of misey and pain (Eryılmaz and Ercan, 2010).
Research has indicated that there are many factors affecting happiness. These can be classified as demographic variables such as age, gender income level, health, self-respect, self-esteem, social relations, marital status; personality traits such as self-efficacy and extroversion, introvertness or neuroticism and social support variables such as family, friends and close environment. Studies showed that there is a positive relation between happiness and optimism (Sapmaz and Doğan, 2012; Gülcan and Bal, 2014) self-esteem (Blatt and Zuroff, 1992; Dogan and Eryılmaz, 2013) and religiosity (Cirhinlioglu and Ok, 2010; Satan, 2014).
The researchers explained the factors that determine the happiness as follows. They specified 3 groups of determinants for happiness as genetic factors, goal-oriented activities and living conditions (Lyubomirsky, 2007; Dogan and Eryılmaz, 2013). Much research has been done on the topic. For example, Dogan and Eryılmaz (2013) found according to research results that genetic traits were the most important determinant of happiness. Targeted events (success, fulfillment of belief, etc.) account for 40% of a significant proportion of happiness. Life conditions correspond to 10%. Eryilmaz and Öğülmüş (2010) showed in their research that personality traits that explain happiness are responsibility, emotional imbalance and outwardness.
Although studies by other researchers (Taylor et al., 2001; Tong and Song, 2004) found no significant relationship between happiness and gender, income, age, marital status; Akın and Şentürk (2012) examined the results of different studies with ordinal logistic regression analysis to reveal the change of happiness level over years. The results of the study showed that as incomes increase, happiness also increases and that students and pensions are generally happy.
Studies that examined the relationship between happiness and emotional imbalance have indicated that there is a negative relationship between these two concepts (Furnham and Cheng, 1997; Brebner, 1998; Penley and Tomaka, 2002). Eryilmaz and Öğülmüş (2010) explained why individuals who are emotionally unstable tend to exhibit a lower pattern in terms of their subjective experience as they experience negative experiences. Akın and Verger (2011) have argued that the reason for this may arise in the society where people are growing up. Joshanloo and Weijers (2014) pointed out that Western cultures and psychology differ from other societies in their research, and that the concept of personal happiness is the most important concept in Western society and that guides people in their lives. Researchers have expressed that other societies, unlike Western society, have negative opinions about happiness, while others in these societies are afraid of happiness. Joshanloo and Weijers (2014) have tried to explain the causes of those societies based on belief cultures with their evidence as proof of fear of happiness in their research. The researchers collected these fears in three groups according to the viewpoints of the societies. These are: a) Happiness is not always a very valid value. B) Belief values tend to reduce and prevent the happiness of that community; and c) Happiness is something to be afraid of. Researchers have linked the fear of happiness they have studied among cultures to four factors. These are: a) fear of bad things, b) belief that happiness is peculiar to bad people, c) belief that it is bad to express happiness, and d) belief that it is bad to search for happiness.
In order to carry out the researches about the beliefs of the Turkish society towards fear of happiness, it is considered that the existence of measurement tools that can measure this characteristic will have an important contribution to literature. The scale of fear of happiness does not emphasize the causes of fear of happiness. The scale is created in such a way as to reveal the main theme of whether happiness or good luck causes unhappiness or bad luck. There were no scales published in Turkish regarding this subject. For this reason, it is necessary to present this scale to researchers who will work in the field of fear of happiness, which is a field of positive psychology. To meet this need, the reliability and validity of the Fear of Happiness Scale developed by Joshanloo and Weijers (2014) will be examined.
2. Method
2.1. Working Group
The sample group of our research consists of 180 university students studying at Bartın University Faculty of Education in the academic year 2014-2015. The sample group consisted of 87% male and 23% of female population. The average age of the sample group was 21-25, the age range 17-25.
2.2. Data Collection Tools
2.2.1. Fear of Happiness Scale (FHS)
The scale was developed by Joshanloo (2013a) in order to measure individuals' fear of happiness. İt is a 7 likert type measuring tool. In the structure validity analysis of the scale, the exploratory factor analysis was used. As a result of the exploratory Factor analysis, the scale revealed 65.7% of the total variance. It was also seen that the scale has a one-factor structure. Scale factor loadings are as follows: .92; .90; .88; .66; .62. The internal consistency reliability coefficient of the scale is .86 and the test -retest reliability coefficient is between .72 and .79.
2.3. Data Analysis
Joshanloo (2013a) was asked for permission for the Fear of Happiness Scale. Then the scale was translated into Turkish. The scale has been translated into Turkish by four academicians from Turkish, English Literature and Guidance and Psychological Counseling departments. The translation of the scale was then translated back to English. At the end of these studies, the scale was been made ready to use. In order to achieve a similar scale validity in the scale adaptation, the criterion-related validity method was used to evaluate the validity and reliability of the scale, followed by confirmatory factor analysis, test retest reliability and internal consistency methods. SPSS 15 and Amos 8 programs were used in the analysis of the data.
3. Findings
3.1. Structure Validation
3.1.1. Exploratory Factor Analysis (EFA)
In order to determine the factor structure of the scale, Exploratory Factor Analysis was performed first. Barlett sphericity test χ2 value of normality test was 280.008 and (KMO) .82 (p <.000). It has been seen that scores are normally distributed based on these data. As a result of the exploratory factor analysis, it was found that the scale has an one-factor structure. The scale explains 65% of the total variance. The detailed factor loadings of the scale are given in Table 1.
Table-1. Factor loadings and variance value of the Fear of Happiness Scale.
| İtems | Factor Loadings |
| I usually prefer not to be so enjoyable because it brings back sadness | 0.92 |
| I think the more cheerful and happy I will be, the more bad things will happen in my life. | 0.9 |
| Bad things usually happen after good things. | 0.88 |
| Having too much fun and cheering causes bad things to happen | 0.66 |
| Too much fun can have bad consequences | 0.62 |
| Explained Variance | 65.09% |
| Eigenvalue | 3.254 |
Source: Joshanloo (2013a) items of the fear of happiness scale
3.1.2. Confirmatory Factor Analysis (CFA)
The Fear of Happiness Scale was revealed to be a one-factor structure as a result of exploratory factor analysis. Confirmatory Factor Analysis was performed to determine whether this factor structure is appropriate for Turkish culture. As a result of the analysis, the compliance indices of the scale were firstly tested at the ratio of the value against the free value was founs meaningful at χ2 = 1523,30, sd = 100, χ2 / sd = 1.523 p = .00. This value should be 2 or below (Hooper et al., 2008). RMSEA Acceptable value is 0.08, while perfect fit is 0.05. Thescale's RMSEA is found to be 0.06, which is in the acceptable range. The SRMR of the scale was found to be 0.03. A small SRMR value of less than 0.05 indicates good compatibility (Byrne and Campbell, 1999). AGFI (adjusted goodness index) = 0.92, GFI (compliance index) = 0.97. Normative Compliance Index (NFI) = 0.98, Relative Compliance Index (RFI) = 0.95 Comparative Compliance Index (CFI) = 0.99, Increasing Compliance Index (IFI) = 0.99. The values we specify are values ranging from 0-1. The acceptable range of these values is expected to be 0.90 and the perfect fit range to be 0.95 (Bentler, 1990; Schermelleh-Engel et al., 2003). When the values are examined, it can be seen that the one factor structure of the Happiness Fear Scale is a reliable and valid measuring instrument in the sample group of Turkish culture and Turkish university students.
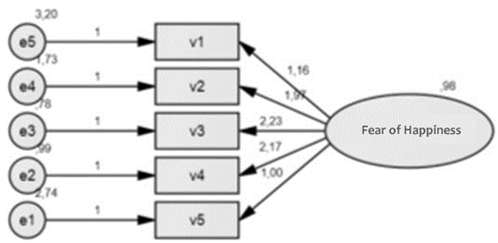
Figure-1. The Confirmatory Factor analysis of the Fear of Happiness Scale.
Source: confirmatory factor analysis of the fear of happiness scale AMOS program analysis diagram
3.2. Item Analysis and Reliability
The item analysis of scale items was done. The results of the item analysis showed that the correlation values were .64; .72; .56; .60; .66 respetively. The internal consistency coefficient of the scale was found to be .86. and is shown in Table 2.
Table-2. İtem correlation value of the Fear of Happiness Scale.
| İtems | İtem correlation |
| I usually prefer not to be so enjoyable because it brings back sadness | 0.64 |
| I think the more cheerful and happy I will be, the more bad things will happen in my life. | 0.72 |
| Bad things usually happen after good things. | 0.56 |
| Having too much fun and cheering causes bad things to happen | 0.6 |
| Too much fun can have bad consequences | 0.66 |
| Internal consistency coefficient | 0.86 |
4. Discussion
The aim of this study is to examine the validity and reliability of the Turkish version of the scale in order to determine whether the Fear of Happiness Scale (FHS) by Joshanloo and Weijers (2014) is suitable for Turkish culture. Before the findings of the study were presented, it appears that the statistical analysis of the number of groups participating in the study was sufficient for the validity and reliability calculations. The scale has been translated into Turkish. The scale has been translated into Turkish by four academicians from Turkish, English Literature and Guidance and Psychological Counseling. The scale was then translated back to English. At the end of these studies, the scale became ready to use. Selected analytical methods for examining the validity of the structure of the FHS are Exploratory Factor Analysis and Confirmatory Factor Analysis .As a result of the Exploratory Factor Analysis operations performed, the scale was found to be one-dimensional as in the original form and the explained total variance ratio was calculated as 65%. This ratio is 30% and more for the variance ratio explained in the scale development and adaptation studies and it is seen that the scale validity is provided when compared with the criterion values. The findings of the study show that the model is in good compliance with the CFA compliance index limits, which is another factor analysis. These findings indicate that the original factor structure of the FHS scale is compatible with the factor structure of the Turkish form. When the results of the findings about whether the scale items adequately represent the scale are examined, it is seen that the reliability of the FHS is sufficient. Tezbaşaran (1996) states that the level of reliability predicted for the measurement tools that can be used in researches is .70. The reliability of the FHS can be attributed to the fact that the scale is reliable when compared to the findings of Tezbaşaran (1996). It is seen that the values of corrected item-total correlations of the FHS scale change from .63 to .92. These findings appear to be higher than the .30 measure. Büyüköztürk (2004) states that in the interpretation of item-total correlation, items with .30 and higher can distinguish individuals very good in terms of their measured characteristics. When the findings of the study are compared with the results of Büyüköztürk (2004) it is seen that the item-total correlations of the scale are sufficient.
The findings of the analysis from the Fear of Happiness Scale reveal that it is ready to use. The selected sample group for the reliability and validity study of the Happiness Fear Scale consists only of university students. Therefore, the reliability and validity of the Fear of Fear Scale on different groups make it necessary to support the findings of this study.
In summary, it can be said that the Fear of Happiness Scale, which is an advantageous scale due to its practicality and short time applicability and its ease of scoring, is a good measure to measure the level of happiness fear of university students.
References
Akın, A. and A.S. Verger, 2011. Subjective happiness scale: Validity and reliability study. Sakarya University Journal of Education Faculty, 21(21): 65-77.
Akın, B. and E. Şentürk, 2012. Investigation of individuals' happiness levels using ordinal logistic regression analysis. Proposal. C, 30(37): 183-193.
Argyle, M., M. Martin and J. Crossland, 1989. Happiness as a function of personality and social encounters. In J.P. Forgas & J.M. Innes (Eds.), Recent advances in social psychology: An international perspective. Amsterdam: North Holland, Elsevier Science. pp: 189- 203.
Ben-Zur, H., 2003. Happy adolescents: The link between subjective well-being, internal resources, and parental factors. Journal of Youth and Adolescence, 32(12): 67-79.View at Google Scholar
Bentler, P.M., 1990. Comparative fit indexes in structural models. Psychological Bulletin, 107(12): 238–246.View at Google Scholar | View at Publisher
Blatt, S.J. and D.C. Zuroff, 1992. Interpersonal relatedness and selfdefinition: Two prototypes for depression. Clinical Psychology Review, 12(5): 527–562. View at Google Scholar | View at Publisher
Brebner, J., 1998. Happiness and personality. Personality and Individual Differences, 25(2): 279-296. View at Google Scholar | View at Publisher
Büyüköztürk, Ş., 2004. Manual of data analysis for social sciences. 4th Edn., Ankara: Pegem A Publishing.
Byrne, B.M. and T.L. Campbell, 1999. Cross-cultural comparisons and the presumption of equivalent measurement and theoretical structure: A look beneath the surface. Journal of Cross-Cultural Psychology, 30(5): 557–576. View at Google Scholar | View at Publisher
Cirhinlioglu, F.G. and Ü. Ok, 2010. Relations between faith or worldview forms and suicide attitudes, depression and satisfaction with life. CU Journal of Social Sciences, 34(1): 1-8.View at Google Scholar
Diener, E., 1984. Subjective well-being. Psychological Bulletin, 95(3): 542-575. View at Google Scholar
Diener, E., 2000. Subjective well-being. The science of happiness and a proposal for a national index. American Psychologist, 55(1): 34–43. View at Google Scholar | View at Publisher
Dogan, T. and A. Eryılmaz, 2013. An examination of the relationship between self-esteem and subjective well-being. Pamukkale University Education Faculty Magazine, 33(33): 107-117.
Eryılmaz, A. and L. Ercan, 2010. Examination of the relationship between subjective well-being and perceived control. Primary Education Online, 9(3): 952-959.
Eryilmaz, A. and S. Öğülmüş, 2010. Subjective well-being in adolescence and a five-factor personality model. Ahi Evran University Kırşehir Education Faculty Journal, 11(3): 189-203.
Furnham, A. and H. Cheng, 1997. Personality and happiness. Psychological Reports, 80(3): 761-762. View at Google Scholar
Gülcan, A. and P.N. Bal, 2014. An investigation of the effect of optimism on happiness and life satisfaction in young adults. E-AJI Asian Journal of Instruction, 2(1): 41-52. View at Google Scholar
Hooper, D., J. Coughlan and M. Mullen, 2008. Structural equation modelling: Guidelines for determining model fit. Electronic Journal of Business Research Methods, 6(1): 53-60. View at Google Scholar
Joshanloo, M., 2013a. The influence of fear of happiness beliefs on responses to the satisfaction with life scale. Personality and Individual Differences, 54(5): 647-651.View at Google Scholar | View at Publisher
Joshanloo, M. and D. Weijers, 2014. Aversion to happiness across cultures: A review of where and why people are averse to happiness. Journal of Happiness Studies, 15(3): 717-735.View at Google Scholar | View at Publisher
Kangal, A., 2013. A conceptual evaluation on happiness and some results for Turkish households. Electronic Journal of Social Sciences, 12(44): 214-233.
Lyubomirsky, S., 2007. The how of happiness: A scientific approach to getting the life you want. NY: The Penguin Press.
Myers, D. and E. Deiner, 1995. Who is happy. American Psychological Society, 6(1): 1-19.
Penley, J.A. and J. Tomaka, 2002. Associations among the big-five, emotional responses, and coping with acute stress. Personality and Individual Differences, 32(7): 1215-1228. View at Google Scholar | View at Publisher
Sapmaz, F. and T. Doğan, 2012. Investigation of the effect of optimism on happiness and life satisfaction. Mersin University Education Faculty Magazine, 8(3): 63-69.
Satan, A.A., 2014. The effect of religious belief and cognitive flexibility levels to subjective well-being levels. Education and Society in the 21st Century, 3(7): 56-74.
Schermelleh-Engel, K., H. Moosbrugger and H. Müller, 2003. Evaluating the fit of structural equation models: Tests of significance and descriptive goodness-of-fit measures. Methods of Psychological Research, 8(2): 23-74. View at Google Scholar
Taylor, R.J., C.M. Linda, B.H. Cheryl and R. Anna, 2001. Informal social support networks and subjective well-being among African Americans. Journal of Black Psychology, 27(4): 439-463. View at Google Scholar | View at Publisher
Tezbaşaran, A.A., 1996. Validity of psychological testing used in Turkey. Bulletin of Turkish Psychology(4).
Tong, Y. and S. Song, 2004. A study on general self- efficacy and subjective well- being of low SES collage students in a Chinese university. College Student Journal, 38(4): 637-643. View at Google Scholar
Vaillant, G.E., 2003. Mental health. American Journal of Psychiatry, 160: 1373-1384. View at Google Scholar