The Effect of Mathematics Instruction through Computer Algebra Systems on the Academic Achievements of Secondary Education Students: Turkey Example
1Faculty of Arts and Sciences, Adıyaman University, 02040, Adıyaman, Turkey
2Kazım Karabekir Faculty of Education, Atatürk University, 25240, Erzurum, Turkey
Abstract
The purpose of this study is to determine the effect of the mathematics teaching, which is carried out by mathematics teachers through computer algebra systems, on the achievement of students. A hundred and forty five 10th grade students have taken part in the study as participants. In the research where quantitative research methods were used, quasi-experimental design was used. In the study, class implementations were carried out by three mathematics teachers who had in-service training about the integration of the computer algebra systems to the learning-teaching environments beforehand. In the implementations at issue, teachers carried out computer-assisted instructions about parabola through Mathematical software in experimental groups. In control groups, they carried out the lessons by using information and communication technologies at a baseline level using traditional teaching method. In the research, students' mathematics report grades and also parabola achievement tests, which were used as the pretest and the posttest, were used as data collection tool. The data obtained from the research were analyzed through Mann-Whitney U and Wilcoxon signed ranks tests. Besides, the effect size of the obtained data was calculated. As a result of the research, it was seen that the achievement of the experimental group, whose lessons were carried out with computer algebra systems by providing technology integration at transformation level, are higher than the achievement of the control group, whose lessons were carried out with the traditional teaching method by providing technology integration at replacement level. Besides, as the calculated effects size is considered, it is understood that computer algebra systems have a strong effect in the occurrence of the differences between the two groups.
Keywords:Computer-assisted mathematics instruction, Computer algebra systems, Levels of technology integration, Graphs of quadratic functions, Academic achievement.
1. Introduction
With the technological progress, in today's world which faces rather different problems that previous generations didn't confront, individuals who appreciate mathematics, who have improved mathematical power of thinking, who can use mathematics in modelling and problem solving are needed more than ever. Nowadays information and communication technology (ICT) is developing rapidly and it offers new opportunities for significant mathematics instruction (Ministry of National Education, 2013). Priority objectives in the use of computers in mathematics teaching are to prompt students' top-end cognitive skills and ensure them form their own mathematics knowledge on the basis of their interactions with computers (Baki, 2006). It is emphasized in several researches that Mathematics is difficult to learn and harder than the other disciplines because of its abstract structure (Herzig, 2002; Sarama and Clements, 2009; Yenilmez and Avcu, 2009) . According to Baki (1996) “what is more important than the use of a computer as an effective calculation tool is its feature of transporting abstract mathematics concepts to the screen and materializing them”. This materializing transaction will affect students' significant learning process positively. Therefore students' process of configuring mathematical knowledge should be supported with multiple representations and materials and they should be ensured to use ICT actively in mathematics learning process. The purpose of using ICT in mathematics teaching is not to change the place of learning mathematical skills with the technology; rather, it is to make mathematical thought accessible to all students regardless of their skill levels. With the active use of ICT, students can work on real-realistic mathematics problems and they can use the time gained from long calculations on reasoning, creative thinking (MNE, 2013).
Akdemir (2017) it can be accepted that in a close future, computer-assisted instruction (CAI) will be a part of education systems by completing ICTs' integration to the instruction schedule (Güven et al., 2009). Kaya and Akdemir (2016) CAI is students' benefiting from computers during education process so as to determine their deficiencies by mutual interaction and identify their performance and get their own learning under control by getting feedbacks, and it also makes students be more interested in the lessons with the help of graphics, sounds, animations and figures (Baki, 2006). In computer-assisted mathematics instruction (CAMI) activities, the most important softwares that can be used in forming positive learning-teaching environment and to support mathematics learning and teaching are computer algebra systems (CAS) which are based upon the use of symbolic expressions and dynamic geometry softwares (DGS) that are concentrated on geometrical structures (Hohenwarter and Fuchs, 2004; Hohenwarter and Jones, 2007; Tatar, 2012) . The use of dynamic geometry and algebra softwares in learning-teaching environments has caused new conceptions to occure (Hohenwarter and Fuchs, 2004). As a matter of fact, when the recent developments are considered, CASs look like they are going to be mandatory and standard tools in mathematics learing and teaching (Ersoy, 2005).
With the improvement of mathematics and technology, the search for being able to transact faster and flawlessly appears to us within advanced calculators and various computer softwares. CASs are the products of this search (Tuluk, 2007). CASs, which are developed as softwares that can do symbolic calculation besides numerical calculation to solve mathematical problems are obtained by expanding standard numerical programming languages like C, Pascal and Fortran (Aktümen, 2007). Here, while the word “Symbolic” refers to result's close and figurative expression, the word “Algebraic” emphasizes a certain result (Davenport et al., 1993; Kabaca, 2006). CASs' other prominent features other than being effective symbolic calculation tools are their ability to plot advanced graphs and their ability to visualize. Thanks to these enhanced abilities of theirs, CASs can plot in cartesian, polar, cylindrical coordinates. An example of a three-dimensional graph which has been plotted through Mathematica, a CAS that has been used in the class implementations in this research is included in Figure 1.
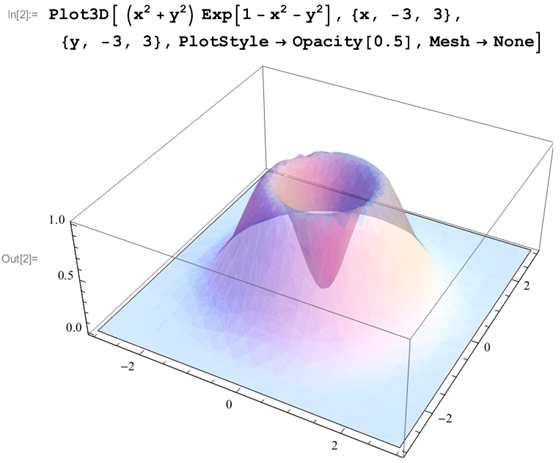
Figure-1. 3D Graph Plotting Through Mathematica
Source: Authors generated by using Mathematica.
Beside it identifies many known file formats and can take action on them, it is possible for Mathematica to save a “.nb” file (Mathematica's standard notebook extension) in numerous formats without any data loss. For example, it can save a “.nb” file as a “.swf” (Flash) file instantly. Mathematica's another remarkable feature is the CDF (Computer Document Format). CDF is a format that eliminates the necessity of Mathematica to be installed on the computer in order to run any program or material which is created through Mathematica. Thanks to CDF Player, which can be installed freely, one can examine the structures which are prepared by the programmer and can interfere as far as allowed. Besides, the structures of Mathematica such as slide etc. that allow the user to manipulate the mathematical and geometrical structure are significant features which intersect with DGSs.
When we examine the literature, it is understood that the teaching activities, which are carried out through CASs, effect students' conceptional comprehension levels (Ghosh, 2003; Kabaca, 2006; Aksoy, 2007; Sevimli, 2013; Sevimli and Delice, 2015) problem solving skills (Aktümen, 2007; Tuluk, 2007; Sevimli, 2013) academic achievements (Stephens and Konvalina, 1999; Aksoy, 2007; Bulut, 2009) calculational skills (Bulut, 2009; Sevimli, 2013) mathematical thinkings (Tuluk, 2007; Bulut, 2009) attitudes towards mathematics (Kabaca, 2006; Aksoy, 2007; Aktümen, 2007; Tuluk, 2007; Aktümen and Kaçar, 2008; Taşlıbeyaz, 2010) positively. Again, similar results are emphasized also in literature reviews (Lavicza, 2008; Buteau et al., 2010; Marshall et al., 2012) that mention teaching activities which are carried out through CASs. These results show that through CASs, students learn mathematics with better and deeper comprehension, they improve their autonomous learnings and develop their achievements, CASs increase students' motivation towards mathematics and make students deal with the harder and realistic mathematical structures earlier by making those structures more simple, through CASs, a teaching that answers the needs of 21st Century career field occurs.
As a result of the literature review that's been carried out; it is understood that there are very few studies in which CASs are used as learning-teaching tools (Tatar et al., 2013). It is also seen that those studies were intended to teach Calculus subjects to participants who are undergraduate students, just like it can be seen in the international literature (Lavicza, 2008; Buteau et al., 2010; Marshall et al., 2012) . On the other hand, it is understood that CAS-based graphical calculators are used in the studies at secondary education levels (Baki and Celik, 2005; Pierce et al., 2009) computer-based implementations are not used directly enough when compared to CAS-based graphical calculators (Pierce et al., 2009). Besides, in several literature compilations, it is emphasized that data collection methods such as achievement tests are not used sufficiently in order to get the results of CAS implementations (Lavicza, 2008; Buteau et al., 2010; Marshall et al., 2012) . It is seen in most of the researches in which achievement tests are used that the achievements of the participants in the teaching environments where CASs are used are compared to the achievements of the participants in the teaching environments where ICTs are not integrated at any level. This situation can make it difficult to understand whether the differences between the obtained data is from the software that is used, from the hardware itself or from the teaching method. Because the authority is not just teachers during the process of the technology integration to the learning-teaching environment (Yieng and Daud, 2017). The authority is prorated to all partners of the integration process including technological tools (Bingölbali et al., 2012). To ensure the technology integration to the learning-teaching environments is a complicated, dynamic, slow and long-termed process at any level (Usluel and Demiraslan, 2005; Harris et al., 2007; Koehler et al., 2007; Groff and Mouza, 2008) . With this aspect, it has been thought that it will produce more understandable results when the teaching activities in which CASs are used, are approached with the teaching activities in which the technology integration is ensured at different levels.
In order to determine at which levels the technology integration is ensured, three levels are suggested by Hughes (2005). Those are Replacement, Amplification and Transformation levels.
Replacement: A situation in which the use of technology just provides environment change; nothing more like different purposes or gains (Hughes, 2005; Akkoç et al., 2011). Reflecting a mathematics problem to the board through a projector by a mathematics teacher can be an example for a use at this level.
Amplification: At this level where a simplification is aimed by the use of technology; performing the learning process effectively and fast is the matter without any change in the tasks or objectives (Hughes, 2005; Akkoç et al., 2011). At this level, in which radical alterations are not needed in in-class routines and implementations, technological tools are considered to be used in order to perform a set of activities more effectively and faster in learning-teaching process. Likewise, operating a complicated and time-consuming arithmetical transaction faster and flawlessly through a calculator can be an example for a use at this level (Demir and Ozmantar, 2013).
Transformation: It is to execute the technology integration in a way that students can develop deep comprehension about a certain subject (Demir and Ozmantar, 2013). Hughes (2005) expresses that the teachers would be considered to have ensured a top-end technology integration when their pedagogical approaches change the class routines and provide deep learning. With a technology integration at this level, it can be achieved for students to understand conceptional patterns of mathematical structures and link up the internal connections among those patterns (Akkoç et al., 2011). Carrying out the activities in order to reach conceptional comprehension with the softwares that can help associate different figurations of the function concept such as algebraic, graphic and table can be given as an example for a use at this level (Ozmantar et al., 2010; Demir and Ozmantar, 2013) .
A literature review has been carried out to determine which subject the mathematics teachers will carry out class implementations about. In this review, it has been understood that the secondary education students and even the teacher candidates comprehend quadratic function graph subject (Parabola) difficultly (Eisenberg and Dreyfus, 1994; Zaslavsky, 1997; Borgen and Manu, 2002; Zazkis et al., 2003; Durmuş, 2004; Kutluca, 2008; Tatar et al., 2008; Kutluca and Baki, 2009) they have hard time explaining quadratic function concept, plotting the graph and they make mistakes during this process (Zaslavsky, 1997; Sajka, 2003; Bos, 2007; Metcalf, 2007; Kutluca, 2009) . On the other hand, it has been seen that MNE gives place to the learning outcome of explaining the changes, which happens in the graphical representation of the alteration in coefficients with reasons in graphical representations of a quadratic function and using information and communication technology effectively during this process, in the mathematics curriculum of the secondary education. Having said that, it has been understood that CAMI activities which have been carried out using mostly DGSs affect students' achievement positively (Bos, 2007; Kutluca, 2009; Phonguttha et al., 2009; Ayvaz, 2010) . In the research, by considering the difficulties students faced about parabola that are stated in the literaure and the clear guidance of instruction schedules about the use of ICT in teaching the subject, it has been decided to approach the effects of the CAMI activities that will be carried out by teachers through CASs over this subject. Moreover, it has been thought that the results which were obtained from the previous studies in which DGSs were used can be used as criteria in measuring the data of this study in which CASs have been used.
1.1. Aim of the Study
An answer to that problem has been sought in this study, in which the effect of mathematics teaching, that is carried out with CASs by ensuring the technology integration at advanced levels and mathematics teaching that is carried out by ensuring the technology integration at basic levels, on the secondary education students' achievements:
What is the effect of the CAMI activities through CASs to the achievement of 10th grade students about quadratic function graph?
2. Method
Measurable and ordinal data is needed to determine the effect of CAMI activities through Mathematica to the achievement of 10th grade students on parabola. For this reason, quasi-experimental design, which is a quantitative research method, has been used in the research. The main purpose is to test the cause and effect relation among factors in experimental designs (Büyüköztürk et al., 2010). The quasi-experimental design which has been used in the research is summed up in the Table 1.
Table-1.The experimental Design of the Research
| Determining the Groups | Group |
Pretest |
Class Implementations |
Posttest |
| Students' mathematics report grades | Experimental group |
PAT |
CAMI environment using CAS software |
PAT |
Control group |
PAT |
Traditional teaching environment using ICTs |
PAT |
PAT: Parabola achievement test
Students' mathematics report grades mean before the implementation has been used in determining the control group and the experimental group in the study. It has been decided randomly about which class to be the control group or the experimental group. In determining the study groups, quasi-experimental design has been used as there has been no equation done between groups. After determining the groups, PAT (Ardıç and Işleyen, 2018a) has been carried out in order to determine the achievement levels of the students of the control group and the experimental group about parabola before the implementation.
The class implementations of the research have been carried out by three secondary education mathematics teachers. Aforesaid teachers participated in the in-service trainings before, which were carried out by the researchers and aimed at CAS use during CAMI (Ardıç and Işleyen, 2018b). During the implementation, teachers have used the ICTs by projecting textbooks on the interactive board or doing sample analysis about the subject along with the traditional teaching methods such as direct instruction and catechization in control groups (Ardıç and Işleyen, 2017a). That technology use at issue has been limited at a basic level that was named “replacement” by Hughes (2005). On the other hand, in the experimental groups, teachers have carried out lessons through CASs via dynamic materials and work sheets, which have been developed by the researchers (Ardıç and Işleyen, 2017b) in an environment where students can interact with computers. In the experimental groups in which Mathematica have been used, CAMI activities have been carried out at “transformation” (Hughes, 2005) levels in a way that students can improve deep comprehension (Ardıç and Işleyen, 2017a). Class implementations have lasted six lesson hours in each group considering the time that the teachers allocate to the subject in their annual plans. At the end of the class implementations, PAT has been carried out for the students of the control group and the experimental group as a posttest.
2.1. Participants
Participants of the research consisted of 145 10th grade students. 75 of the participants who were from three different type of high schools in Adıyaman, which is located in the southeast of Turkey, participated in control group, while 70 of them participated in the experimental group (Table 2).
Table-2. The Information about the Participants
| School Types | Anatolian High School |
Anatolian Imam Hatip High School |
Anatolian Vocational High School |
Sum |
| Experimental Groups | 22 |
16 |
32 |
70 |
| Control Groups | 22 |
21 |
32 |
75 |
| Sum | 44 |
37 |
64 |
145 |
Source: Data obtained from authors field study.
The 10th grade students studying in the school where the research was carried out, their families and the school managements were informed about the research process at the beginning of the study. The participants were designated on a volunteer basis. Signed consent was obtained from the parents or the guardians of the 10th grade students participating in the research. Besides, the necessary official permission was obtained from the Provincial Directorate for National Education, where the study was carried out.
2.2. Data Collection and Data Analysis
After examining the literature review (Bos, 2007; Kutluca, 2009; Phonguttha et al., 2009; Ayvaz, 2010; Kabaca et al., 2011; Kutluca and Zengin, 2011) in order to determine the effect of the CAMI activities through Mathematica to the 10th grade students about parabola and by consulting the opinions of mathematics educationists, it was decided to use an academic achievement test consisted of open-ended questions.
When forming the PAT that was used in the research, a preliminary draft which consisted of 32 items was created by benefiting from 10th grade mathematics textbooks (Kaplan, 2008; Alkan, 2012; Erel, 2014) and subsidiary sources by considering the specified learning outcomes about parabola in the secondary education mathematics curriculum (MNE, 2013) at first step. To ensure the accuracy and the content validity of the items that took part in the preliminary draft, the preliminary draft in question was submitted with its table of specifications to the examinations of three experts, who have doctor's degree in mathematics education, and three mathematics teachers. After doing the required adjustments in accordance with the suggestions coming from the experts and teachers, the PAT draft which consisted of 28 items were created.
The created draft has been applied to 128 10th grade students from 3 different schools, one of which is a science high school and the other two are Anatolian high schools within the pilot study that has been carried out by the researchers. Each correct answer to each question is worth 4 points in the answer key that has been created to use in measuring the PAT draft. In order to ensure the reliability in grading, some help has been received from a mathematics educationist. The PAT drafts, which have been answered by the students in the pilot scheme, have been measured by an expert, who has a doctor's degree in mathematics education, in accordance with the answer key. The measurement results done by the expert have been compared to the measurement results done by the researchers through Cohen's Kappa reliability coefficient. When considering the question-based reliability mean, it has been understood that with the calculated 0.813 kappa rate, almost perfect harmony has been achieved among the measurers (Landis and Koch, 1977). It has been decided to measure the achievement test via the answer key which has been prepared by the researchers in deference to harmony levels among the measurers.
After descendingly sorting the scores obtained from the pilot scheme of the PAT draft, 27% of lower and upper groups have been specified. Examining the differences between the item mean scores of the upper and lower groups of 27% via t-test for independent samples is a method that can be applied within item analysis (Büyüköztürk, 2012). The coming out of the required significant observed differences is the indicator of the test's internal consistency and to what extent the items distinguish the individuals in regard to measured behavior. In the examination, it has been understood that just one of the test items does not have distinctiveness at significant levels according to the results of the t-test for independent samples and it has been removed from the PAT draft. The blank-filling question that has been removed from the test goes like this: “When the number a is negative, as it decreases (as it increases in absolute value) the branches of the parabola ... ... ... ... ... ...”.
After removing the item in question from the test, again an expert's opinion has been applied after reforming the PAT in order to ensure the content validity and positive feedbacks have been received. In addition to this, Cronbach's Alpha test has been carried out in an attempt to prove the accuracy and the internal consistency of the scores obtained from the achievement test. In consideration of the data obtained from the pilot study, Cronbach's Alpha internal consistency coefficient of the test has been calculated 0.942. Thereby, it has been decided that the PAT, which is consisted of 27 open-ended questions as its final state, is reliable to use in the research.
In the research, one control group and one experimental group have been formed by gathering the data on the three control groups and three experimental groups which have been formed during the class implementations. Additionally, tests of normality have been carried out in order to decide which tests to be used in analyzing the obtained quantitative data. Because, in order to use parametric tests in the performed analysis, distributions of the measurements related to dependent variable in independent measurements have to offer normal distribution in both groups, while the difference scores related to the measurement set have to offer normal distribution in dependent measurements (Field, 2009). A In the test of normality, Shapiro-Wilk test (Büyüköztürk, 2012) and coefficient of skewness - coefficient of kurtosis and “z” statistics obtained from the ratio of these coefficients to their standard errors have been used in the research. Z statistics have to be valued between -1.96 and 1.96 so the data won't be skew or kurtosis (Cramer, 1998; Doane and Seward, 2011). In addition to this, the histograms related to the data, the Q-Q and the box plots have been examined by the researchers in order to determine if they ensure the normal distribution of the data obtained from the study or not. It has been planned to use “t-test for dependent samples” and “t-test for independent samples” in situations where the normal distribution is achieved in the preliminary examinations done in the research. On the other hand, it has been decided to use “Wilcoxon signed rank test”, which is assumed to be a nonparametric alternative to the t-test for dependent samples, and “Mann-Whitney U Test”, which is assumed to be a nonparametric alternative to the t-test for independent samples when there is no normal distribution (Büyüköztürk, 2012). In the study, in analyzing the data, SPSS 22.0 software has been used and the value 0.05 has been considered as the statistical significance level. Besides, in calculating the effect size of the data that has been obtained from the research, the formulas in the Table 3 (Field, 2009) have been used.
Table-3. Effect Size Calculation Methods
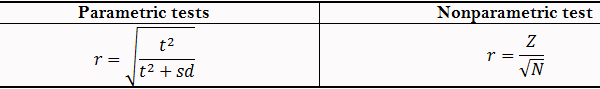
Source: The equations obtained from Field, 2009.
In evaluating the effect size, r=.10 (small effect), r=.30 (medium effect), r=.50 (large effect) criteria that were specified by Cohen (1992) have been consulted.
The tests have been evaluated by both the researchers and the domain expert by using the answer key that has been prepared by the researchers, in order to ensure the reliability in the data obtained from the PAT in the research. The measurements of the expert and the researchers have been examined by each question through Cohen's Kappa coefficient. When considering the question-based reliability mean, with the calculated 0.846 Kappa value, it has been understood that “almost perfect harmony” (Landis and Koch, 1977) has been achieved between the evaluators.
3. Findings and Results
In this section, the obtained findings aimed at the effect of the CAMI activities, that have been carried out over CAS, to the achievement of the 10th grade students on the parabola subject are given place.
Before starting the class implementations, it has been examined if there is a significant difference between the experimental group's and control group's report grades and the scores obtained from the PAT test which has been performed as a pretest. A test of normality has been carried out to the data in order to decide which test to be used to make the comparison in question.
It has been understood from the analyses on the Shapiro-Wilk test results of the control group's students' report grades (W=0.923, p<.05), histogram related to the data, Q-Q and box plots that they do not have normal distribution. Skewness (1.048, SE=0.276) and kurtosis (0.932, SE=0.545) values also support this result. It has been decided to make the comparison through Mann-Whitney U test, which is a nonparametric test because the data related to the control group does not have normal distribution.
Table-4. Mann-Whitney U Test Results of the Mathematics Report Grades According to the Groups
| Groups | N |
Mean Rank |
Sum of Rank |
Mann-Whitney U |
Z |
p |
| Control | 76 |
72.7 |
5525 |
2599 |
-1.193 |
0.233 |
| Experimental | 77 |
81.25 |
6256 |
Source: Data obtained from authors field study.
As the values on the Table 4 are considered, it is understood that there is no significant difference between the mathematics report grades of the students from the experimental group and the control group (U=2599, p>.05, r=-.096).
According to the Shapiro-Wilk test results of the pretest scores of the control group (W=0.851, p<.05) and when considering the histogram, Q-Q and box plots, it is understood that the data does not have normal distribution. The statistics about the skewness (4.297, SE=0.548) and kurtosis (7.086, SE=0.694) also support this result. Likewise, it is also seen that the scores of the experimental groups do not have normal distribution according to both their Shapiro - Wilk test (W=0.878, p<.05) and skewness (1.33, SE=0.287) and kurtosis (1.977, SE=0.566) statistics. By visual examination of the histogram related to the data, Q-Q and box plots, the same result has been occurred. Thus, it has been decided to use Mann-Whitney U test in order to analyze the significance of the difference between the PAT pretest scores of the groups (Table 5).
Table-5. Mann-Whitney U-Test Results of the Pretest Scores According to the Groups
| Groups | N |
Mean Rank |
Sum of Rank |
Mann-Whitney U |
Z |
p |
| Control | 75 |
74.97 |
5622.5 |
2.478 |
-0.587 |
0.557 |
| Experimental | 70 |
70.89 |
4962.5 |
Source: Data obtained from authors field study.
When analyzing the Mann-Whitney U test results (U=2.478, p>.05, r=-.049) ,it has been understood that there is no significant difference statistically between the groups in terms of the scores obtained from applying the PAT as a pretest.
Hereby, it has been understood that there was no significant difference between the control group and the experimental group in terms of achievement before the class implementations that have been carried out by the mathematics teachers.
Pretest and posttest scores of the groups have been compared in themselves in order to determine if the class implementations that have been carried out about parabola have any effect on the achievements of the 10th grade students. Before starting this comparison, it has been checked that if the data of which mean will be compared has normal distribution or not, in order to decide which statistical tests will be used during the process.
When considering the Shapiro-Wilk test results, it has been seen neither that nor the difference scores of the control group (W=0.936, p<.05) neither the difference scores of the experimental group (W=0.946, p<.05) have normal distribution. Again, the same result has occurred when the histogram, Q-Q and box plots of the difference scores of the groups has been examined. Thereby, it has been decided to use Wilcoxon signed rank test for dependant measurement which is a nonparametric method.
Table-6. Wilcoxon Signed Rank Test Results According to the Control Group's Posttest-Pretest
| Posttest-Pretest | N |
Mean Rank |
Sum of Rank |
Z |
p |
| Negative Ranks | 2 |
14 |
28 |
-7.38* |
0 |
| Positive Ranks | 73 |
38.66 |
2822 |
||
| Ties | 0 |
- |
- |
*Based on negative ranks
The results of the analysis show that there is a significant difference between the posttest scores and the pretest scores of the control group students (Z=-7.38, p<.001, r=-.85). When the rank sum of the students is considered, it is seen that this difference is on the side of positive ranks, namely posttest scores. According to these results, it is understood that the activities teachers have carried out by using traditional teaching methods and ICTs at basic levels in the control groups have a positive effect to the academic achievements of the 10th grade students.
Table-7. Wilcoxon Signed Rank Test Results According to the Experimental Group Posttest-Pretest
| Posttest-Pretest | N | Mean Rank | Sum of Rank | Z | p |
| Negative Ranks | 0 | - | - | -7.273* | 0 |
| Positive Ranks | 70 | 35.5 | 2485 | ||
| Ties | 0 | - | - |
*Based on negative ranks
It is seen that there is a significant difference between the experimental group's pretest scores and posttest scores when the analysis results in Table 7 are considered (Z=-7.273, p<.001, r=-.87). It is understood that this difference is on the side of the posttest scores when the test scores rank mean and the rank sum are considered. Thus, it can be said that CAMI activities that have been carried out by the mathematics teachers through the CAS software have a positive effect on the achievements of the 10th grade students about parabola.
Firstly, it has been looked at whether it meets normality assumption of the test scores or not in order to decide which test to use to understand if there is a significant difference between the control group and the experimental group students' posttest scores. It is understood that the scores do not have normal distribution when the Shapiro - Wilk test results (W=0.889, p<.001) and the skewness value (1.039, SE=0.277) of the control group's students' posttest scores are examined. The histogram, Q-Q and box plots related to control group's posttest scores also support this result. Likewise, it has been also understood that the experimental group's posttest scores have no normal distribution according to both Shapiro-Wilk test (W=0.929, p<.001) and skewness value (0.568, SE=0.287) and histogram, Q-Q and box plots related to test scores. It has been decided to use Mann-Whitney- U test since the normality assumption in analyzing the significance of the difference between the groups' scores of PAT's posttest couldn't be achieved (Table 8).
Table-8. Mann-Whitney U-test Results of the Posttest Scores According to the Group
| Groups | N | Mean Rank | Sum of Rank | Mann-Whitney U | Z | p |
| Control | 75 | 50.41 | 3780.5 | 930.5 | -6.71 | 0 |
| Experimental | 70 | 97.21 | 6804.5 |
Source: Data obtained from authors field study.
According to Mann-Whitney U test results (U=930.5, p<.001, r=-0.56), it is understood that there is a statistically significant difference between the posttest scores of the control group and experimental group. It is seen that this difference is on the side of the experimental group, as the rank mean and the rank sum of the groups are examined.
4. Conclusion and Recommendations
It has been understood that there is no significant statistical difference between the control group's and the experimental group's mathematics report grades mean and pretest scores mean before the implementation. Considering these results, it can be said that participants in the control group and the experimental group have equal readiness levels before the implementation. This result is a preferred situation for a sound research.
It is understood from the research that, according to the results of the Mann-Whitney U-test, which has been applied to the posttest scores, the academic achievements of the experimental group students is statistically different at significant levels and higher than the academic achievements of the control group students. Herefrom, it is seen that the groups, whose lessons have been carried out through CASs with CAMI method at high levels, such as “transformation” by using the ICTs, are more successful than the groups, whose lessons have been carried out by using traditional teaching method at basic levels, such as “replacement” by using the ICTs. Besides, it is understood that the CAMI activities which have been carried out through CASs have a strong effect (Cohen, 1992) in the occurrence of the difference between the groups when the effect size is considered. This result matches up with the findings which are situated in the literature about the positive effect of the CAMI activities on parabola subject in which various softwares such as CASs (Bos, 2007; Kutluca, 2009) and DGSs (Phonguttha et al., 2009; Ayvaz and Ozdemir, 2010) are used. Similar results have been found in the studies, in which CAS softwares have been used for lecturing different subjects and university students have taken part as participants in general (Hillel, 1993; Porzio, 1994; Cooley, 1995; Stephens and Konvalina, 1999; Aksoy, 2007; Bulut, 2009; Sevimli, 2013; Sevimli and Delice, 2015) .
Teachers can be provided trainings about CAMI and CASs such as Mathematica so they can benefit from ICTs by achieving the technology integration at high levels in their lessons. In lessons, the work sheets and dynamic materials used have a great importance in achieving the CAMI in which the technology integration is achieved at a high level. For this reason, the teachers or the researchers have to design the work sheets and the dynamic materials in question finely before they begin the activities about CAMI.
It can be said that one of the main differences which separates CAMI from the traditional teaching methods is that students make individual inferences by interacting with computers. That interaction is usually achieved with dynamic materials. Students can be provided trainings about CASs such as Mathematica in order to level up their interactions with computers. Thus, students can not only use the dynamic materials that are presented for them, but also they can form their own computer programs about mathematical structures. Again, teachers can give their students home works in a way they can benefit from CASs differently by this means. Likewise, by enabling students to use CASs at higher levels, it can be achieved to use CASs at assessment and measurement phase, too.
In order to make the effects of CAMI activities through CASs more understandable, new studies, in which different subjects of mathematics and geometry are approached, can be done. By means of these studies in question, the teachers who want to use CAMI in their lessons can be ensured to have opinions about which subject and at what levels they can achieve a technology integration, positive and negative sides of the process and the effects of CAMI on the students' achievements.
References
Akdemir, A.S., 2017. Etwinning in language learning: The perspectives of successful teachers. Journal of Education and Practice, 8(10): 182-190.
Akkoç, H., M.F. Ozmantar, E. Bingölbali, S. Demir, S. Baştürk and İ. Yavuz, 2011. The aim of this course is to teach mathematics teacher candidates with pedagogical knowledge about technology. The Scientific and Technological Research Council of Turkey (TUBITAK) Project of Number 107K531.Istanbul, Turkey.
Aksoy, Y., 2007. The effect of computer algebra systems in the teaching of the concept of derivative. Unpublished Doctoral Dissertation. University of Gazi, Institute of Educational Sciences, Ankara, Turkey.
Aktümen, M., 2007. The effect of computer algebra systems on the teaching of the definite integral concept. Unpublished Doctoral Dissertation. University of Gazi, Institute of Educational Sciences, Ankara, Turkey.
Aktümen, M. and A. Kaçar, 2008. Effects of computer algebra systems on attitutes towards mathematics. Hacettepe University Journal of Education, 35(1): 13-26.
Alkan, H., 2012. Secondary mathematics 10th grade textbook. 2nd Edn., Ankara: MNE State Books.
Ardıç, M.A. and T. Işleyen, 2017a. High school teachers’ levels of achieving technology integration and in-class reflections: The case of mathematica. Universal Journal of Educational Research, 5(12B): 1-17.Available at: https://doi.org/10.13189/ujer.2017.051401.
Ardıç, M.A. and T. Işleyen, 2017b. A process of material development towards teaching the subject of parabola using computer algebra systems. In A.O. Akdemir, A. Ekinci, I. Han, E. Set, F. Dadasoglu, K. Karagoz, A. Öztekin (Eds.), II. International Conference on Advances in Natural and Applied Sciences AIP Conf. Proc. 1833, 020113-1–020113-6.
Ardıç, M.A. and T. Işleyen, 2018a. The test development process for determining secondary school students' achievements on parabola. In M. Z. Sarıkaya, A. O. Akdemir, E. Set, A. Ekinci (Eds.), 1th International Conference on Mathematics and Related Sciences AIP Conf. Proc. 1991, 020025 (2018).
Ardıç, M.A. and T. Işleyen, 2018b. Development process of in-service training intended for teachers to perform teaching of mathematics with computer algebra systems. In M. Tosun, S. Ersoy, K. Ilarslan (Eds.), 6th Internatioanal Eurasian Conference on Mathematical Sciences and Apllications AIP Conf. Proc. 1926, 020005 (2018).
Ayvaz, R.Z., 2010. Computer supported mathematics with geogebra. Procedia-Social and Behavioral Sciences, 9: 1449-1455.
Ayvaz, R.Z. and Ş. Ozdemir, 2010. Using geogebra as an information technology tool: Parabola teaching. Procedia-Social and Behavioral Sciences, 9: 565-572.
Baki, A., 1996. Is the computer everything in mathematics teaching? Mathematical teaching. Hacettepe University Journal of Education, 12(1): 135-143.
Baki, A., 2006. From concept to practice mathematics education. 3th Edn., Trabzon: The Derya Bookstore.
Baki, A. and D. Celik, 2005. The views of mathematics teachers on the adaptation of graphing calculators to mathematics courses. Turkish Online Journal of Educational Technology, 4(4): 146-162.
Bingölbali, E., F. Ozmantar, Y. Sağlam, S. Demir and A. Bozkurt, 2012. Professional development model of primary school teachers in science and mathematics and dissemination of this model. TÜBİTAK (The Scientific and Technological Research Council of Turkey) Project of Number 108K330. Gaziantep, Turkey.
Borgen, K.L. and S.S. Manu, 2002. What do students really understand? The Journal of Mathematical Behavior, 21(2): 151-165.
Bos, B., 2007. The effect of the Texas instrument interactive instructional environment on the mathematical achievement of eleventh grade low achieving students. Journal of Educational Computing Research, 37(4): 351-368.Available at: https://doi.org/10.2190/ec.37.4.b.
Bulut, M., 2009. The effect of computer algebra systems in constructivist approach based cooperative learning environment on mathematical thinking and academic performance of students. Unpublished Doctoral Dissertation. University of Gazi, Institute of Educational Sciences, Ankara, Turkey.
Buteau, C., N. Marshall, D. Jarvis and Z. Lavicza, 2010. Integrating computer algebra systems in post-secondary mathematics education: Preliminary results of a literature review. International Journal for Technology in Mathematics Education, 17(2): 57-68.
Büyüköztürk, Ş., 2012. Data analysis manual for the social sciences: Statistics, research design, SPSS applications and interpretation. (16th Edn.,). Ankara: Pegem Publishing Publishing.
Büyüköztürk, Ş., E. Kılıç Çakmak, Ö.E. Akgün, Ş. Karadeniz and F. Demirel, 2010. Scientific research methods. 7th Edn., Ankara: Pegem Publishing Publishing.
Cohen, J., 1992. A power primer. Psychological bulletin, 112(1): 155-159.
Cooley, L.A., 1995. Evaluating the effects on conceptual understanding and achievement of enhancing an introductory calculus course with a computer algebra system. Unpublished Doctoral Dissertation.. New York University, New York. Dissertation Abstracts International, 56: 3869.
Cramer, D., 1998. Fundamental statistics for social research. London: Routledge.
Davenport, J.H., Y. Siret and E. Tournier, 1993. Computer algebra, systems and algorithms for algebraic computation. London, UK: Academic Press LTD. pp: 12.
Demir, S. and F. Ozmantar, 2013. Pedagogical principles in technology-assisted mathematics teaching [Pedagogical principles in technology-assisted mathematics instruction]. In M. Doğan, & E. Karakınık (Eds.), Technological usage in mathematics education in mathematics education. (2th Edn.,). Ankara: Nobel Publishing. pp: 1-26.
Doane, D.P. and L.E. Seward, 2011. Measuring skewness. Journal of Statistics Education, 19(2): 1-18.
Durmuş, S., 2004. A diagnostic study to determine learning difficulties in mathematics. Gazi University Kastamonu Education Journal, 12(1): 125-128.
Eisenberg, T. and T. Dreyfus, 1994. On understanding how students learn to visualize functions and transformations. Dubinsky, A., Schoenfeld & J. Kaput (Eds.), Research in Collegiate Mathematics. Providence, RI: American Mathematical Society, 4: 45 - 68.
Erel, T., 2014. Secondary mathematics 10 textbook. Istanbul: Netbil Publishing.
Ersoy, Y., 2005. The views of science lyceum mathematics teachers-i: The media of mathematics teaching and some constraints. The Turkish On Line Journal of Educational Technology, 4(4): 135-145.
Field, A., 2009. Discovering statistics using SPSS. (3rd Edin.,). London: Sage.
Ghosh, J., 2003. Visualizing solutions of systems of equations through mathematica. Australian Senior Mathematics Journal, 17(2): 13-28.
Groff, J. and C. Mouza, 2008. A framework for addressing challenges to classroom technology use. AACe Journal, 16(1): 21-46.
Güven, B., Ü. Çakiroğlu and Y. Akkan, 2009. The gap between expectations and reality: Integrating computers into mathematics classrooms. Asia Pacific Education Review, 10(4): 505-515.Available at: https://doi.org/10.1007/s12564-009-9047-7.
Harris, J., P. Mishra and M. Koehler, 2007. Teachers’ technological pedagogical content knowledge: Curriculum-based technology integration reframed. Paper Presented at the American Educational Research Association Conference, Chicago.
Herzig, A.H., 2002. Where have all the students gone? Participation of doctoral students in authentic mathematical activity as a necessary condition for persistence toward the. PH. D. Educational Studies in Mathematics, 50(2): 177-212.Available at: http://dx.doi.org/10.1023/A:1021126424414.
Hillel, J., 1993. Computer algebra systems as cognitive technologies: Implications for the practice of mathematics education. In C. Keitel, & K. Ruthven, (Eds.), Learning from computers: Mathematics education and technology. Berlin: Springer-Verlag. pp: 18-47.
Hohenwarter, M. and K. Fuchs, 2004. Combination of dynamic geometry, algebra and calculus in the software system geogebra. Computer Algebra Systems and Dynamic Geometry Systems in Mathematics Teaching Conference. P´ecs, Hungary.
Hohenwarter, M. and K. Jones, 2007. Ways of linking geometry and algebra: The case of GeoGebra. In D. Küchemann (Ed.), Proceedings of the British Society for Research into Learning Mathematics. University of Northampton, UK: BSRLM. pp: 126-131.
Hughes, J., 2005. The role of teacher knowledge and learning experiences in forming technology-integrated pedagogy. Journal of Technology and Teacher Education, 13(2): 277-302.
Kabaca, T., 2006. The effect of computer algebra systems in teaching the concept of limit. Unpublished Doctoral Dissertation. University of Gazi, Institute of Educational Sciences, Ankara, Turkey.
Kabaca, T., E.G. Çontay and E. İymen, 2011. Algebraic representation of geometric representation with dynamic mathematics software: Parabola concept. Journal of Pamukkale University Education Faculty, 30(30): 101-110.
Kaplan, E., 2008. Secondary mathematics 10 textbook. Ankara: Paşa Publishing.
Kaya, Z. and A.S. Akdemir, 2016. Learning and teaching: Theories approaches and models. Ankara: Solution Education Publishing.
Koehler, M.J., P. Mishra and K. Yahya, 2007. Tracing the development of teacher knowledge in a design seminar: Integrating content, pedagogy and technology. Computers & Education, 49(3): 740-762.Available at: https://doi.org/10.1016/j.compedu.2005.11.012.
Kutluca, T., 2008. Determination of subjects that mathematics teacher candidates perceive as difficult in 10th grade mathematics teaching program. ICES 08 International Conference on Educational Science and Technology, East Mediterranean University, Famagusta, K.K.T.C.
Kutluca, T., 2009. Evaluation of a computer assisted learning environment designed for the subject of quadratic functions. Unpublished Doctoral Dissertation. University of Karadeniz Teknik, Institute of Sciences, Trabzon, Turkey.
Kutluca, T. and A. Baki, 2009. Examination of the views of students, teacher candidates and teachers about the issues in the 10th grade mathematics course. Kastamonu University Kastamonu Education Journal, 17(2): 616-632.
Kutluca, T. and Y. Zengin, 2011. Evaluation of student views on the use of geogebra in mathematics teaching. Dicle University Ziya Gökalp Faculty of Education Journal, 17: 160-172.
Landis, J. and G. Koch, 1977. The measurement of observer agreement for categorical data. Biometrics, 33(1): 159-174.Available at: https://doi.org/10.2307/2529310.
Lavicza, Z., 2008. The examination of computer algebra systems (CAS) integration into university-level mathematics teaching. Unpublished Doctoral dissertation, The University of Cambridge, Cambridge.
Marshall, N., C. Buteau, D.H. Jarvis and Z. Lavicza, 2012. Do mathematicians integrate computer algebra systems in university teaching? Comparing a literature review to an international survey study. Computers & Education, 58(1): 423-434.Available at: http://dx.doi.org/10.1016/j.compedu.2011.08.020.
Metcalf, R.C., 2007. The nature of students’understanding of quadratic functions. Unpublished Doctoral Dissertation, The State of University New York, Buffalo.
Ministry of National Education, 2013. Curriculum of secondary school mathematics lesson (9-12th classes). Ankara, Turkey: MEB Publishing. pp: 24.
MNE, 2013. Secondary mathematics (9-12th grade) curriculum [curriculum of secondary school mathematics lesson (9-12th classes)]. [Accessed 20 July 2013].
Ozmantar, M.F., H. Akkoc, E. Bingolbali, S. Demir and B. Ergene, 2010. Pre-service mathematics teachers' use of multiple representations in technology-rich environments. EURASIA Journal of Mathematics, Science & Technology Education, 6(1): 19-36.Available at: https://doi.org/10.12973/ejmste/75224.
Phonguttha, R., S. Tayraukham and P. Nuangchalerm, 2009. Comparisons of mathematics achievement, attitude towards mathematics and analytical thinking between using the geometer's sketchpad program as media and conventional learning activities. Australian Journal of Basic and Applied Sciences, 3(3): 3036-3039.Available at: https://doi.org/10.2139/ssrn.1285446.
Pierce, R., L. Ball and K. Stacey, 2009. Is it worth using cas for symbolic algebra manipulation in the middle secondary years? Some teachers’ views. International Jorunal of Science and Mathematics Education, 7(6): 1149-1172.Available at: http://dx.doi.org/10.1007/s10763-009-9160-4.
Porzio, D.T., 1994. The effects of differing technological approaches to calculus on students’ use and understanding of multiple representations when solving problems. Unpublished Doctoral Dissertation, The Ohio State University. Dissertation Abstracts International, 55: 3128.
Sajka, M., 2003. A secondary school student's understanding of the concept of function-a case study. Educational Studies in Mathematics, 53(3): 229-254.
Sarama, J. and D.H. Clements, 2009. Concrete computer manipulatives in mathematics education. Child Development Perspectives, 3(3): 145-150.Available at: https://doi.org/10.1111/j.1750-8606.2009.00095.x.
Sevimli, E., 2013. [the effect of a computer algebra system supported teaching on processes of representational transition in integral topics of students with different types of thinking. Unpublished Doctoral Dissertation. University of Marmara, Institute of Educational Sciences, Istanbul, Turkey.
Sevimli, E. and A. Delice, 2015. Can technology-assisted instruction improve theoretical awareness? The case of fundamental theorem of calculus. International Computer and Mathematics Education, 6(1): 68-92.Available at: http://dx.doi.org/10.16949/turcomat.44905.
Stephens, L.J. and J. Konvalina, 1999. The use of computer algebra software in teaching intermediate and college algebra. International Journal of Mathematical Education in Science and Technology, 30(4): 483-488.Available at: http://dx.doi.org/10.1080/002073999287761.
Taşlıbeyaz, E., 2010. A case study research intended for mathematics perception at computer aided mathematics teaching for secondary students: Application of high school 3rd year. Unpublished Master's Thesis), University of Atatürk, Institute of Educational Sciences, Erzurum, Turkey.
Tatar, E., 2012. The effect of dynamic mathematics software on achievement in mathematics: The case of trigonometry. Energy Education Science and Technology Part B-Social and Educational Studies, 4(1): 459-468.
Tatar, E., B.T. Kağızmanlı and A. Akkaya, 2013. Content analysis of the researches on technology-assisted mathematics instructıon in Turkey. Buca Faculty of Education Journal, 35: 33-50.
Tatar, E., M. Okur and A. Tuna, 2008. A study on the determination of learning difficulties in secondary mathematics. Kastamonu Education Journal, 16(2): 507-516.
Tuluk, G., 2007. The effect of computer algebra systems on the teaching of the concept of function. Unpublished Doctoral Dissertation University of Gazi, Institute of Educational Sciences, Ankara, Turkey.
Usluel, Y.K. and Y. Demiraslan, 2005. A framework to investigate ICT integration into teaching-learning process: Activity theory. Hacettepe University Journal of Education, 28(1): 134-142.
Yenilmez, K. and T. Avcu, 2009. Sixth grade students’ success levels on algebra learning domain. Ahi Evran University Journal of Education Faculty, 10(2): 37-45.
Yieng, W.A. and K.B. Daud, 2017. Technology leadership in Malaysia's high performance school. Journal of Education and eLearning Research, 4(1): 8-14.Available at: 10.20448/journal.509/2017.4.1/509.1.8.14.
Zaslavsky, O., 1997. Conceptual obstacles in the learning of quadratic functions. Focus on Learning Problems in Mathematics, 19(1): 20-44.
Zazkis, R., P. Liljedahl and K. Gadowsky, 2003. Conceptions of function translation: Obstacles, intuitions, and rerouting. The Journal of Mathematical Behavior, 22(4): 435-448.Available at: https://doi.org/10.1016/j.jmathb.2003.09.003.