The Effect of Educational Videos Used in History Education on Academic Success
Ağrı İbrahim Çeçen University Faculty of Science and Letters, Department of History, Ağrı-Turkey
Abstract
The purpose of the research is to examine and assess the videos used in history education. In the study, the academic success levels of the students who received their history education through videos that comprise of voice, text, animation and sound components. Also, answers to the question of whether there is any difference in the academic success levels of students who received their education through video components were looked for, via 50 multiple-choice questions. Furthermore, the views and experiences of students on the topic of the education given were researched through 7 semi-structured qualitative questions. In the research; three short videos used in history education that were prepared in different styles were used. Two of these videos were merged due to them sharing the same topic. The study universe consists of about 400 students at high school (9th grade) level in Ağrı province. The sample was chosen by using purposeful sampling method. According to the acquired findings; history education videos were noted to be of vital contribution to motivation and learning. While it may make it easier to determine which topics and styles cause gaps in learning, the results obtained in this research, it may also contribute greatly to improve and solve these.
Keywords:History education, History education videos, Ancient history videos, Educational videos, Video-based learning.
1. Introduction
In present day which is the age of digital technology also known as the fourth industrial revolution, multimedia tools are seen to have become part of daily lives of people. Likewise, multimedia tools are used in many disciplines with different interface and Technologies in this age dubbed the digital age (Seixas, 1994; Swan, 1994; Kelly, 2001; Kobrin, 2001; Masterman and Rogers, 2002; Schrum and Hong, 2002; Lee et al., 2006; Mishra and Koehler, 2006; Harding and Ingraham, 2007; Brush and Saye, 2008; Diaz et al., 2008; Swan and Locascio, 2008; Berson and Berson, 2009; Hardy and Jefferies, 2010; Sharpe et al., 2010; Mohamad and Chong, 2011; Beck and Eno, 2012; Krauss and Boss, 2013; Hofer and Swan, 2014; Romrell et al., 2014; Kurihara, 2016; Söylemez, 2016; Marone, 2017; Sarikaya, 2017; Sarikaya, 2018; Söylemez, 2018; Demirel, 2018a; Demirel, 2018b) Stephenson [Cigar box Projects’i (Kelly, 2013; Krauss and Boss, 2013)]). Akdemir (2017) the fact that multimedia tools are the focal point of many educators has lead to the widespread research of how the effectiveness of the learning process must be provided with these tools (Schrum, 2001; Weis, 2001; Berson and Balyta, 2004; Kingsley and Boone, 2008; Hammond and Manfra, 2009; Oostveen et al., 2011; Chou et al., 2012; Bates, 2015; Ragland, 2015; Schwab, 2016) . Kaya and Akdemir (2016) upon examination of the researches in the literature, it is seen that videos, which are in widespread use among multimedia tools are also becoming widely used in education (Angeli and Tsaggari, 2016; Yazıcı and Kültür, 2016) . Especially the fact that it provides multiple multimedia components to learners in the process of effective and rapid learning may be shown among the reasons why the use of these tools are becoming widespread (Crook, 1996; Akkoyunlu and Yılmaz, 2005; Siti et al., 2016; Turan et al., 2016; Gündüz, 2017; Kuzu, 2017).
In history education, we witness that multimedia tools are essential for the improvement of learning, logic, effective and useful citizenship and democratic awareness, the creation of a satisfactory and prospective historical awareness. In this context, videos, which are a part of multimedia tools, can remedy the problems in history education that are mainly caused by rote-learning (Barton and Levstik, 2003). In order for videos to be among the effective learning tools, it is beneficial for the components offered by these tools must be prepared in accordance with multimedia design principles (Mayer and Sims, 1994; Mayer, 2003; Mayer and Moreno, 2003; Moreno and Mayer, 2007; Joseph and Joy-Telu, 2016) . In this research, the main focus of the research problem consists of researching the effect of the learning process through videos that were prepared in accordance with multimedia design principles on academic success and cognitive load of the students. The purpose of this study is to research the effect of multimedia components in multimedia tools on the academic success in history education. Accordingly, the research questions are as follows:
a) What are the success levels of the students who received history education through voiced and written components?
b) What are the success levels of the students who received history education through animation and sound components?
c) Is there a significant difference in the success levels of the students who received education through different video components?
d) What are the opinions and experiences of the students on the topic of the education given?
2. Method
In this research, the use of consecutive descriptive pattern among mixed research methods was preferred. The mixed research method, as much as it is a research pattern in accordance with philosophical principles and propositions, it is also considered as a method. In the mixed method research, qualitative and quantitative data are gathered in the scope of a specific system, and their combined use is facilitated, as it is purposed towards reaching the correct and extensive conclusion in the explanation of the research problem (Creswell and Clark, 2014). In this context, quantitative data was gathered and analyzed first, and then the qualitative data was gathered in order to corroborate the quantitative data (Creswell and Clark, 2014). The quantitative data consists of the data gathered from the academic success test. The qualitative data, on the other hand, consists of the interviews carried out with the study groups (Yıldırım and Simşek, 2013; Johnson and Christensen, 2014; Patton, 2014; Ekiz, 2015; Miles and Huberman, 2015; Söylemez, 2015; Robson, 2015b; Sarikaya, 2016; Sonmez and Alacapınar, 2016) .
2.1. Sample
The universe of this study consists of high school (9th grade) students in Ağrı province. The sample was determined by using purposeful sampling method, while it consists of 403 students for test I, 452 for test II, 138 for Control group test I, 58 for Control Group test II and the same rates of students for the permanence test. The decision of which of the study groups would be the control group was made using random methods. Details regarding the demographic information of the study groups are shown in Table 1.
Table-1. Demographic Information of the Study Groups
Study Groups |
N |
Age Range |
Video 1 Test |
403 |
14-16 |
Video 2 Test |
452 |
14-16 |
Control G. Test 1 |
138 |
14-16 |
Control G. Test 2 |
58 |
14-16 |
Total |
1051 |
14-16 |
Source: Data have obtained from author’s field study.
2.2. The Study Process
First of all, in this research, a preliminary test was applied to check if there is any significant difference between the average points regarding the academic successes of the study groups. Upon examination of the analysis results according to the data gathered from the preliminary test, the data from the study groups show a normal range (p=0.120) and as a result of t-test analysis results [t100=1.250, p=0.120, r2=0.11] it was determined that there is no significant difference in the average success points of the groups (Field, 2013). Also, the reliability coefficient Cronbach Alpha value of the data gathered from the preliminary test was α=0.72, wherein the success test was seen to be quite reliable.
Afterward the application process was initiated and the students were provided with individual study after lessons using different video recordings, after theoretical lessons. While the experimental group was applied with two different videos, the control group received their education only through traditional methods. The education given to the study groups was provided by the same educator. Details of the study process regarding the experimental and control group are shown in Table 2.
Table-2. Details regarding the study process
Study group |
Study week |
Video features |
Experimental group |
1st Week |
Voice+Text (Video 1)1 |
Video Duration:11 min.* 7 sec**. |
||
2nd Week |
Final test application |
|
3rd Week |
Voice+Animation + Minimal Text (Video 2) |
|
Video Duration:16 min. 27 sec. |
||
4th Week |
Final test application |
|
Control group |
1st Week |
Traditional education |
2nd Week |
Traditional education |
|
3rd Week |
Traditional education |
|
4th Week |
Traditional education |
1 Videos were taken from http://eba.gov.tr. *Minutes, **Seconds,
After the application process, a permanence test was applied a month later in order to measure the permanence of the academic successes of the study groups, and the study process was completed. During the study, videos on the same topic (First Age History Topics) but with different content and multimedia components were used for the validity of the permanence test.
2.3. Data Gathering Tools
In this study, the academic success test developed by the researcher was used as a quantitative data gathering tool. 25 questions each for Video 1; “Concepts of Time Used in the Examination of Historical Events-I: Concepts of Time Used in the Examination of Historical Events-II.” and Video 2: “Introduction to Ages of History and Anatolia, Cradle of Civilizations” so 50 multiple-choice questions in total about the application study was prepared and presented to the students. As a tool of qualitative data gathering tool, semi-structured interview form, prepared by the researcher, was developed. This form consists of 7 qualitative questions. In the semi-structured interview, partial editing or editing with the interviewer upon reconsideration with the target of the questions, meaning the answerer, is the case. Moreover, unplanned questions which emerge in the natural course of the interview may also be asked (Yıldırım and Simşek, 2013; Patton, 2014; Robson, 2015a; Sonmez and Alacapınar, 2016) . For the reliability of the academic success test Cronbach Alpha value was calculated as α=0.72. In this context, it can be said that the success test is reliable. The semi-structured interview form was examined by two experts on the subject, re-edited according to the feedback and the meaningfulness levels of the questions were checked with a 4-person pilot application. After the editing, the form was finalized and the process was completed. Finally, those who were quoted were designated with a “px” in order to reflect the views of the students who took part in our study.
2.4. Analysis of the Data
The quantitative data was analyzed with the help of a statistics program, and then the qualitative data gathered was analyzed through descriptive analysis method before the research was concluded. In the descriptive analysis method, the findings that were handled and interpreted according to the pre-determined main motive are later organized and presented to the reader (Yıldırım and Simşek, 2013; Patton, 2014).
2.5. Boundaries of the Research
a) This research only consists of high school 9th-grade students from the central county of Agri province.
b) In this research, different teachers were employed in the different application processes for the experimental and control groups.
c) The study was completed in four weeks.
3. Findings and Comments
In this chapter, “t” test analysis of the success levels gained by the students as a result of classical instruction and video-aided instruction; the levels of control, success and permanence between two different videos (Test 1-Test 2) was determined with the Anova test.
Table-3. Preliminary test, Final test and Permanence T-Test Results of Video 1
Multimedia Tools |
Average |
S.D. |
N |
Video 1 Prel. test |
321,687 |
1,130,013 |
403 |
Video 1 Final test |
641,290 |
1,379,679 |
403 |
Video 1Permanence |
433,251 |
1,531,432 |
403 |
Source: Data have obtained from author’s field study.
In Table 3, upon examination of the averages of the preliminary test, final test and permanence test; we witness that in the final test there is an increase compared to the preliminary test, there is decrease compared to the final test, but there is an increase compared to the preliminary test. As it can be seen with the findings in Table 3, the success average between the preliminary test and the final test are approximately 99,35%, and in Permanence, there is an increase rate of 34,67%. Some views of the participants on the subject are as follows:
“The second video was boring, as if we were watching a documentary.” (P 281), “The 1st video was nice, the second was boring.” (P 281). “Because we understand better with video.” (P 361), “The 1st video was more effective.” (P403), “It has been visually more permanent in our brains” (P 403), “Because video is more permanent.” (P 25), “Yes, it is more educative to learn by watching.” (P39), “Because it supports visual memory of students in history class” (P 46), “Because we are both informed and have tested our knowledge. That is why it has been a huge contribution. Thanks a lot. For presenting this knowledge to us in the form of video.” (P 55), “No, because it is not permanent in our minds due to not repeating the knowledge we gained.” (P14).
We can observe this situation in the graphic below.
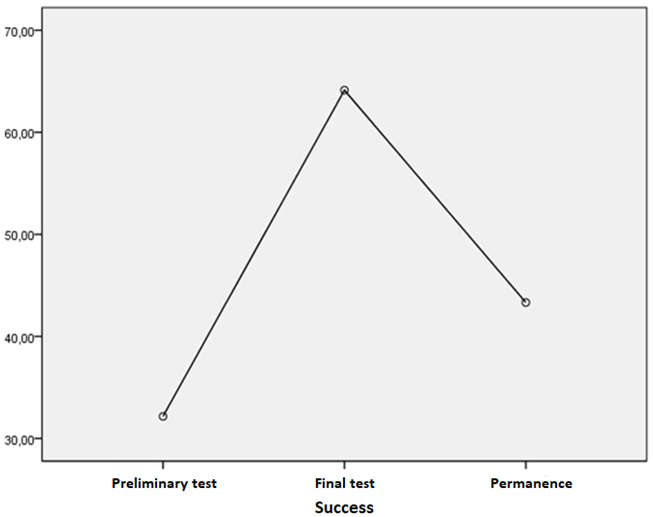
Graphic-1. Preliminary test, Final test and Permanence T-Test Results of Video 1
Table-4. Video 1 Mauchly's Test of Sphericity
Within-Subjects Effect |
Mauchly's W |
Approx. Chi Square |
df |
Sig. |
Epsilona |
|||
Greenhouse-Geisser |
Huynh-Feldt |
Lower-bound |
||||||
1 |
Success |
,971 |
11,771 |
2 |
,003 |
,972 |
,977 |
,500 |
Upon examination of Mauchly’s Test of Sphericity, sphericity hypothesis was achieved due to p< 0.05.
Table-5. Video 1 Tests of Within-Subjects Contrasts
Success
Source |
Time |
Type III Sum of Squares |
df |
Mean Square |
F |
Sig. |
Time |
Level 1 vs. Level 2 |
411,648,635 |
1 |
411,648,635 |
1,280,991 |
,000 |
Level 2 vs. Level 3 |
174,420,486 |
1 |
174,420,486 |
411,148 |
,000 |
|
Error (Time) |
Level 1 vs. Level 2 |
129,183,365 |
402 |
321,352 |
||
Level 2 vs. Level 3 |
170,539,514 |
402 |
424,228 |
Source: Data have obtained from author’s field study.
Upon examination of Table 5; it is seen that there is significant difference between the preliminary test and the final test, the final test and the permanence test; in other words, the method that was applied has a significant effect on the learning of the students, and yet it was not very effective in achieving permanence of the knowledge gained.
Table-6. The preliminary test, Final test and Permanence T-Test Results of Video 2
Multimedia Tools |
Average |
S.D. |
N |
Video 2 Prel. test |
240,354 |
988,800 |
452 |
Video 2 Final test |
373,451 |
1,544,823 |
452 |
Video 2 Permanence test |
271,504 |
1,196,834 |
452 |
Source: Data have obtained from author’s field study.
In Table 6, upon examination of the averages of the preliminary test, the final test and the permanent test; there is an increase in the final test compared to the preliminary test, there is decrease in permanence compared to the final test, but the increase is continuing compared to the preliminary test. As it can be seen with the findings in Table 6, the success average between the preliminary test and the final test is approximately 55,37%, and there is an increase rate of 12,96% in Permanence.
Some of the views of the participants on the topic are as follows:
“But it would be better if the narrators were a bit more lively in their narrations.” (P 171). “Both videos are useful, but the 2nd video is more useful. Because you learn about your past, learn about who lived in these lands.” (P 374), “The last video. Because it made me more curious.” (P 402). “I saw what scientists whom I do not know deal with.” (P 450).
We can also observe this situation in the graphic below.
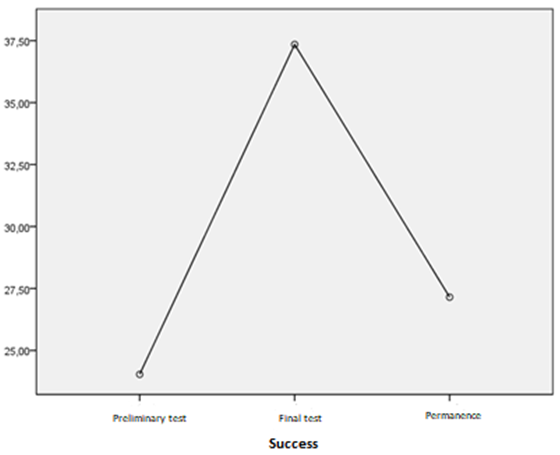
Graphic-2. Preliminary Test, Final Test and Permanence Test Results of Video 2
Table -7. Video 2’in Mauchly's Test of Sphericity
Success
Within-Subjects Effect |
Mauchly's W |
Approx. Chi-Square |
df |
Sig. |
Epsilona |
|||
Greenhouse-Geisser |
Huynh-Feldt |
Lower-bound |
||||||
Zaman |
,920 |
37,427 |
2 |
,000 |
,926 |
,930 |
,500 |
|
When Mauchly's Test of Sphericity was examined, sphericity hypothesis is provided as p< 0.05.
Table-8. Tests of Within-Subjects Contrasts of Video 2
Success
Source |
Time |
Type III Sum of Squares |
df |
Mean Square |
F |
Sig. |
Time |
Level 1 vs. Level 2 |
80,071,363 |
1 |
80,071,363 |
220,680 |
,000 |
Level 2 vs. Level 3 |
46,977,133 |
1 |
46,977,133 |
130,051 |
,000 |
|
Error(Time) |
Level 1 vs. Level 2 |
163,640,637 |
451 |
362,840 |
||
Level 2 vs. Level 3 |
162,910,867 |
451 |
361,221 |
Source: Data have obtained from author’s field study.
Regarding Table 8, it is inferred that there is a significant difference between preliminary test and final test as well as between final test and permanence test; in other words, that the applied method had a significant effect on learning effectiveness of students, but not very effective in providing permanence of what is learned.
Table-9. In-Group Comparison Results Regarding Control Group (Test 1)
Teacher-Centric Instruction |
Average |
S.D. |
N |
Control G. |
263,256 |
1,025,721 |
138 |
Preliminary test 1 |
|||
Control G. |
328,372 |
1,327,524 |
138 |
Final test 1 |
|||
Control G. |
352,093 |
1,214,531 |
138 |
Permanence 1 |
Source: Data have obtained from author’s field study.
When the averages of the preliminary test, final test and permanence test on Table 9 are revised, it is understood that there is an increase in the final test with respect to preliminary test, and in permanence with respect to the final test. As it can be observed from the findings in Table 9, an average of success between preliminary test and final test rose by 24.73% and in permanence by 33,74%. When preliminary tests are compared, we observe that Video 1 is 22,19% better. However, it is seen that it is relatively 18,73% lower than the permanence in Video 1. This case also indicates that writing-based instruction is more beneficial. Besides, when the answers to the question “Which video do you think is more beneficial in the lesson that you have taken as video-aided? Why?”, which is one of the qualitative questions posed to the students, were revised, it was detected that a conclusion is confirming the above-mentioned result which is by 59,83% in favour of video 1. Moreover, when answers to another important qualitative question related to these findings “Which video attracted your attention more in the lesson that you have taken as video-aided? Why?” were examined, it was observed that the work of video 1 attracted far more student’s attention by 60,28%.
Some participant reviews about this case are as follows:
Views about Video 1; “It wasn’t boring.” (P5), “There was higher amount of information.” (P 387), “Easier to understand.” (P 394), “Because it’s more related to my field of interest.” ( P14), “More enjoyable.” (P 33), “It showed some works.” (P 38), “Because I have seen civilizations in Video 2. But in Video 1 I have seen topics that I have never seen before, so it was more interesting for me.” (P 40), “Video 1 was far more enjoyable.” (P 185), “Video 1 embraced simpler topics, others were more intense.”(P 30). “Because it used a more understandable language.” (P160), “The first video was more striking.”(P 288), “It had a better way of instruction.” (P 179), “Because it involved more writing.”(P 381),
Views about Video 2;“The last video I watched was better.” (P 411), “We learned the past of the land we live.” (P 374), “It was more explanatory.” (P 370). “It was more diverse.” (P 49), “It featured more visuals.” (P 16), “I have seen what scientists that I don’t know are dealing with.” (P 451), “Animations were good.” (P 131), “It featured more pictures and it was more interesting.”(P 172), “It was more colourful.” (P 437).
We can see this case in the graphic below:
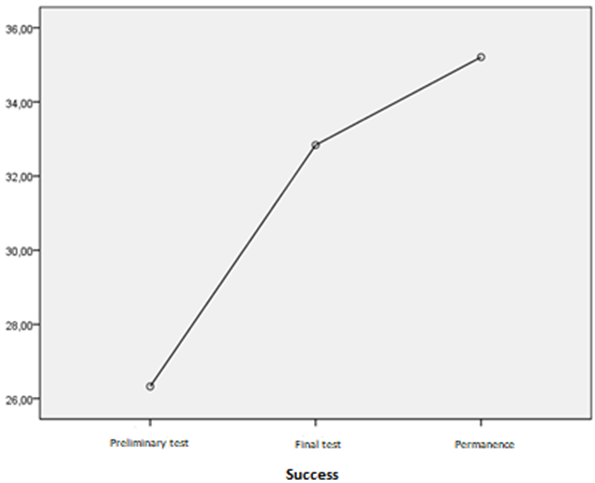
Graphic-3. Within-Group Comparison Results Regarding Control Group (Test 1)
Table-10. Mauchly's Test of Sphericity of Control 1
Success
Epsilona |
|||||||
Within Subjects Effect |
Mauchly's W |
Approx. Chi-Square |
df |
Sig. |
Greenhouse-Geisser |
Huynh-Feldt |
Lower-bound |
Time |
,979 |
23,812 |
2 |
,004 |
,979 |
1,000 |
,500 |
When Mauchly's Test of Sphericity was examined, sphericity hypothesis is provided as p< 0.05
Table-11. Tests of Within-Subjects Contrasts
Success
Source |
Time |
Type III Sum of Squares |
df |
Mean Square |
F |
Sig. |
Time |
Level 1 vs. Level 2 |
3,646,512 |
1 |
3,646,512 |
15,621 |
,000 |
Level 2 vs. Level 3 |
483,907 |
1 |
483,907 |
1,706 |
,195 |
|
Error (Time) |
Level 1 vs. Level 2 |
19,841,488 |
85 |
233,429 |
||
Level 2 vs. Level 3 |
24,108,093 |
85 |
283,625 |
Source: Data have obtained from author’s field study.
Upon examination of Table 11, it is understood that there is a significant difference between the preliminary test and the final test in countenance of the final test, there is no significant difference between the final test and the permanence test; in other words, the applied method has a significant effect on the learning of the students, and yet it has no significant effect in achieving permanence of the knowledge gained.
Table-12. In-Group Comparison Results of Control 2 Group (Test 2)
Teacher-Centric Instruction |
Average |
S.D. |
N |
Control G. Prel. test 2 |
202,069 |
915,894 |
58 |
Control G. Final test 2 |
225,517 |
990,334 |
58 |
Control G. Perm. 2 |
325,517 |
1,386,548 |
58 |
Source: Data have obtained from author’s field study.
In Table 12, upon examination of the preliminary test, the final test and the permanence test averages; it is understood that there is an increase in the final test compared to the preliminary test, and there is an increase in permanence compared to the final test. Moreover, upon considering the data from Video 2, it can be seen that there is a significant increase in the final test of the video study compared to the final test of the control group study. Again as it can be seen in Table 12, there is an approximately 11,60% increase between the preliminary test and the final test, and it is 61,09% in permanence. I think the reason why the continued increase of the permanence rate in Control 2 and its abundance may be due to the low number of students who participated. Also, another important reason why the permanence increased is because when the 9th-grade curriculum is examined; it can be seen that test topics are spread throughout the fall semester. In connection with this, the high repetition of topics may be a reason why the permanence increased.
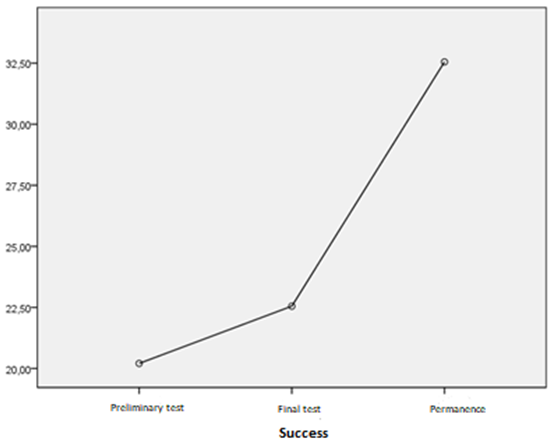
Graphic-4. In-Group Comparison Results of Control 2 Group (Test 2)
Table-13. Control 2 Mauchly's Test of Sphericity
Success
Within-Subjects Effect |
Mauchly's W |
Approx. Chi-Square |
df |
Sig. |
Epsilona |
|||
Greenhouse-Geisser |
Huynh-Feldt |
Lower-bound |
||||||
dimension1 |
Time |
,847 |
9,270 |
2 |
,010 |
,868 |
,892 |
,500 |
Upon examination of Mauchly’s Test of Sphericity, sphericity hypothesis was achieved due to p< 0.05.
Table-14. Kontrol 2 Tests of Within-Subjects Contrasts
Success
Source |
Zaman |
Type III Sum of Squares |
df |
Mean Square |
F |
Sig. |
Time |
Level 1 vs. Level 2 |
318,897 |
1 |
318,897 |
2,593 |
,113 |
Level 2 vs. Level 3 |
5,800,000 |
1 |
5,800,000 |
23,628 |
,000 |
|
Error (Time) |
Level 1 vs. Level 2 |
7,009,103 |
57 |
122,967 |
||
Level 2 vs. Level 3 |
13,992,000 |
57 |
245,474 |
Source: Data have obtained from author’s field study.
Upon examination of Table 14, it was observed that there is no significant difference between the preliminary test and the final test. However, there was a significant difference between the final test and the permanence test in the countenance of the permanence test.
Table-15. a. Comparison Results of Preliminary Test’s Average Success Points
Study Groups |
N |
Average |
S.D. |
Video 1 Test |
403 |
31,56 |
11,417 |
Video 2 Test |
452 |
24,08 |
9,846 |
Control G. Test 1 |
138 |
25,13 |
10,010 |
Control G. Test 2 |
58 |
19,91 |
8,333 |
Total |
1051 |
26,55 |
11,127 |
Source: Data have obtained from author’s field study.
Table-15. b. ANOVA
Preliminary Test
| Sum of Squares | df | Mean Square | F | Sig. | |
| Between Groups | 20,525,236 | 3 | 6,841,745 | 64,070 | ,000 |
| Within Groups | 126,326,430 | 1048 | 106,785 | ||
| Total | 146,851,666 | 1051 |
Source: Data have obtained from author’s field study.
According to the table above, there is a significant difference between groups. Post Hoc analysis was done in order to determine between which groups this significant difference is.
Table-15.c. Multiple Comparisons
Preliminary Test
(I)Group1 |
(J) Group1 |
Mean Difference (I-J) |
Std. Error |
Sig. |
95% Confidence Interval |
|
Lower Bound |
Upper Bound |
|||||
Video 1 |
Video 2 |
7,486* |
,685 |
,000 |
5,72 |
9,25 |
(Test) |
||||||
Control G. |
6,434* |
1,006 |
,000 |
3,85 |
9,02 |
|
(Test 1) |
||||||
Control G. |
11,651* |
1,003 |
,000 |
9,07 |
14,23 |
|
(Test 2) |
||||||
Video 2 |
Video 1 |
-7,486* |
,685 |
,000 |
-9,25 |
-5,72 |
(Test) |
Control G. |
-1,052 |
1,003 |
,721 |
-3,63 |
1,53 |
(Test 1) |
||||||
Control G. |
4,165* |
1,000 |
,000 |
1,59 |
6,74 |
|
(Test 2) |
||||||
|
Control |
Video 1 |
-6,434* |
1,006 |
,000 |
-9,02 |
-3,85 |
(Test 1) |
Video 2 |
1,052 |
1,003 |
,721 |
-1,53 |
3,63 |
Control G. |
5,217* |
1,242 |
,000 |
2,02 |
8,41 |
|
(Test 2) |
||||||
Control |
Video 1 |
-11,651* |
1,003 |
,000 |
-14,23 |
-9,07 |
(Test 1) |
Video 2 |
-4,165* |
1,000 |
,000 |
-6,74 |
-1,59 |
Control G. |
-5,217* |
1,242 |
,000 |
-8,41 |
-2,02 |
|
(Test 1) |
||||||
*. The mean difference is significant at the 0.05 level.
Looking at the Post Hoc analysis results, it is understood that the preliminary test data of Video 1 is much better than that of Video 1. Additionally, it is observed that the data of control test 1 is much better than that of control test 2. Besides, looking at the results of control 2 test and those of Video 1 test, we observe that there emerge results in favor of video 1. When Video 2 test and control 1 test are compared, it is seen that significant differences favoring control 1 emerge.
Table-16.a. Comparison Results of The Final test’s Average Success Points
Study Groups |
N |
Average |
S.D. |
Video 1 Test |
403 |
69,98 |
14,277 |
Video 2 Test |
452 |
31,25 |
13,375 |
Control G. Test 1 |
138 |
33,01 |
13,298 |
Control G. Test 2 |
58 |
19,91 |
8,333 |
Total |
1051 |
47,61 |
22,475 |
Source: Data have obtained from author’s field study.
Table-16.b. ANOVA
Final test
Sum of Squares |
df |
Mean Square |
F |
Sig. |
|
Between Groups |
261,953,969 |
3 |
87,317,990 |
502,508 |
,000 |
Within Groups |
136,578,811 |
783 |
173,764 |
||
Total |
398,532,780 |
789 |
Source: Data have obtained from author’s field study.
According to the table above, there is a significant difference between groups. Post Hoc analysis was done to determine between which groups this significant difference is:
Table-16.c. Multiple Comparisons
Final test
(I) Group2 |
(J) Group2 |
Mean Difference (I-J) |
Std. Error |
Sig. |
95% Confidence Interval |
||
Lower Bound |
Upper Bound |
||||||
Video 1 |
dimension3 |
Video 2 |
31,732* |
1,391 |
,000 |
28,15 |
35,31 |
(Test) |
Control G. |
29,971* |
1,543 |
,000 |
26,00 |
33,94 |
|
(Test 1) |
|||||||
Control G. |
43,069* |
1,278 |
,000 |
39,78 |
46,36 |
||
(Test 2) |
|||||||
Video 2 |
dimension3 |
Video 1 |
-31,732* |
1,391 |
,000 |
-35,31 |
-28,15 |
(Test) |
Control G. |
-1,761 |
1,884 |
,786 |
-6,61 |
3,09 |
|
(Test 1) |
|||||||
Control G. |
11,336* |
1,674 |
,000 |
7,03 |
15,65 |
||
(Test 2) |
|||||||
Control |
dimension3 |
Video 1 |
-29,971* |
1,543 |
,000 |
-33,94 |
-26,00 |
(Test1) |
(Test) |
||||||
Video 2 |
1,761 |
1,884 |
,786 |
-3,09 |
6,61 |
||
(Test) |
|||||||
Control G. |
13,098* |
1,802 |
,000 |
8,46 |
17,74 |
||
(Test 2) |
|||||||
Control |
dimension3 |
Video 1 |
-43,069* |
1,278 |
,000 |
-46,36 |
-39,78 |
(Test 2) |
(Test) |
||||||
Video 2 (Test) |
-11,336* |
1,674 |
,000 |
-15,65 |
-7,03 |
||
Control G. |
-13,098* |
1,802 |
,000 |
-17,74 |
-8,46 |
||
(Test 1) |
|||||||
*. The mean difference is significant at the 0.05 level.
According to the Post Hoc analysis, the significant difference was determined between these groups: when Video 1 final test data and video 2 final test data are compared, it is seen that significant results favoring Video 1 emerge. Apart from that, when the result between Video test 1 and Control G. Test 1 is carefully examined, it is observed that the data of Video test 1 is much better. Besides, as for the findings between Video 1 and Control Group 2, again we observe that the result in favor of Video 1 emerges. When it comes to the findings between Control Groups, it is determined that the data of Control Group 1 is much better than that of Control Group 2. Lastly, when Control 2 data and Video 2 findings are compared, we observe that results are in favor of Video 2.
Tabl-17.a. Comparison Results of Permanence Test Average Success
Study Groups |
N |
Average |
S.D. |
Video 1 Test |
403 |
43,34 |
15,327 |
Video 2 Test |
452 |
27,15 |
11,968 |
Control G. Test 1 |
138 |
33,11 |
12,701 |
Control G. Test 2 |
58 |
29,87 |
12,277 |
Total |
1051 |
33,93 |
15,145 |
Source: Data have obtained from author’s field study.
Table-17b. ANOVA
Permanence
Sum of Squares |
df |
Mean Square |
F |
Sig. |
|
Between Groups |
58,750,954 |
3 |
19,583,651 |
109,644 |
,000 |
Within Groups |
204,332,014 |
1048 |
178,612 |
||
Total |
263,082,969 |
1051 |
Source: Data have obtained from author’s field study.
According to the table above, there is a significant difference between groups. Post Hoc analysis was done to determine between which groups this significant difference is:
Table-17.c. Multiple Comparisons
Permanence Tukey HSD
(I) Group3 |
(J) Group3 |
Mean Difference (I-J) |
Std. Error |
Sig. |
95% Confidence Interval |
|||
Lower Bound |
Upper Bound |
|||||||
dimension2 |
Video 1 |
dimension3 |
Video 2 |
16,191* |
,917 |
,000 |
13,83 |
18,55 |
(Test) |
Control G. (Test 1) |
10,236* |
1,273 |
,000 |
6,96 |
13,51 |
||
Control |
13,468* |
1,302 |
,000 |
10,12 |
16,82 |
|||
(Test 2) |
||||||||
Video 2 |
dimension3 |
Video 1 |
-16,191* |
,917 |
,000 |
-18,55 |
-13,83 |
|
(Test) |
Control G. (Test 1) |
-5,955* |
1,253 |
,000 |
-9,18 |
-2,73 |
||
Control G. |
-2,724 |
1,282 |
,146 |
-6,02 |
,58 |
|||
(Test 2) |
||||||||
Control G. |
dimension3 |
Video 1 |
-10,236* |
1,273 |
,000 |
-13,51 |
-6,96 |
|
(Test 1) |
(Test) |
|||||||
Video 2 |
5,955* |
1,253 |
,000 |
2,73 |
9,18 |
|||
(Test) |
||||||||
Control G. |
3,231 |
1,557 |
,162 |
-,77 |
7,24 |
|||
(Test 2) |
||||||||
Control |
dimension3 |
Video 1 |
-13,468* |
1,302 |
,000 |
-16,82 |
-10,12 |
|
(Test 2) |
(Test) |
|||||||
Video 2 |
2,724 |
1,282 |
,146 |
-,58 |
6,02 |
|||
(Test) |
||||||||
Control G. |
-3,231 |
1,557 |
,162 |
-7,24 |
,77 |
|||
(Test 1) |
||||||||
Source: Data have obtained from author’s field study.
According to the Post Hoc analysis results, it is seen that results of video 1 is much better when Video 1 test and Video 2 test results are compared. Besides, when Video 1 and Control 1 are compared, it is determined that video 1 offers much better data. Apart from that, looking at video 1 and control 2 test results, it is again seen that video 1 is much better. Besides, when Video 2 and control 1 are compared, it is seen that results in favor of Control 1 emerge. Apart from that, again according to Post Hoc analysis results; it is determined that there are no significant differences between Video 2 study and Control 2, and Control 1 and Control 2.
Upon examination of the qualitative questions included in our study, supportive results that encompass the findings above are also seen to have emerged.
Upon examining the answers to the question of “Are you satisfied with the video education you watch in your history classes? Why? Can you explain”, which is included among qualitative questions in our study, it is determined that 70 percent of the answers turn out to be “yes”, which means they are satisfied. Meanwhile, we mostly come across expressions of “informative, instructive, high visual and expressive quality” in the explanations of students. Apart from that, it is observed that they use a considerable amount of expressions like “enjoyable, supportive, explanatory, understandable, that it has good music, that we understand better with video education, it helped me understand and fluent”. Having said that, we observe that among the answers of “no” given to the question aforementioned the expression of “boring” (36%) is mostly used. The reason for this situation is caused by the fact that the instructors in the video generally prefer the direct instruction. Taking into account the expressions of students, it is determined that a great majority of students are not interested in the direct instruction, on the contrary they often comment on and call for the fact that such studies ought to be more enjoyable and colorful. Therefore, we can state that students find Video 1 much more interesting when we consider the success level of students. Also, we come across participants, who find animation and videos interesting, state that the instructors should be more cheerful and teach more energetically, wish that their own school instructors would teach, state that they are not enjoyable, they are too much detailed, and did not like the videos for no good reason among those who gave the answer of “no”. Starting from this point, we can underline the importance of active learning once more.
Upon examining answers by the participants to the question of “Do you think that this lesson method (video-aided education) makes your learning easier? Why?”, which is included in our qualitative study, it is seen that the ratio of “yes” is 77,5%. We observe that 36% of the participants giving positive response state visuals stick in their minds, and again 36% of them state it is a permanent study, 15% of them state the instruction is good, 11% of them state it is enjoyable while 2% of them state it is instructive. When the opinions of those who gave the answer of “no” to the question aforementioned are considered, parallel to the first question, we come across the statement of “boring” by 60% ratio. The reason for this situation is again mostly caused by the direct instruction. On the other hand, it is determined that 15% of the participants, who said “no”, state that their instructors teach lessons with the classical methods, which is direct instruction, while again 15% of them state it is useless without no reason. The remaining 10% is observed to use statements like “that it is too long”, “fast”, “I did not like it”, and “I do not know”.
Another important question included in our qualitative study was that “What kind of positive sides do you think video-aided lesson have? Can you explain?”
Some of the participant opinions about this subject is as it follows:
“Visuals are stuck in the mind.” (P 338), “Visual and aural intelligence improves” (P 373), “It is more enjoyable and catchy.” (P 420), “Thanks to its visuals and writings, video manages to stick in the mind.” ( P 392), “It reminds us things we do not know or we forget.” ( P 340) , “The fluent parts of the video are catchier.” (P 115), “It helped me understand the lesson.” (P 166), “Thanks to video, we are able to remember to some extent.” ( P 45), “To know the past is everyone’s duty. We learn better this way how precious our own history is.”(P 37), “I think history classes should be taught visually so that we can understand better.” (P 46), “It is positive as it remains in memory.” (P 27), “It gained us knowledge and it is such a good thing I learned things I had never heard or seen before.” ( P 6). “I can only picture visual maps and developments in my mind.” ( P 407), “When look at visuals, we can remember better.” (P 412), “We cannot go further only by listening. There should be writing, as well. The palest ink is stronger than the sharpest memory.” (418).
The other research question sentence significantly prepared as an opposition to the qualitative study question aforementioned is “What kind of negative sides do you think video-aided lesson have? What do you think about it?
Even though we have asked our participants about the negative sides of our video-aided study, it is determined that 67,25 % of them state the positive sides of video study.
Some of the participant opinions about this subject as it follows:
“Not much” (P 337), “I don’t think there is any negative side.” (P 352), “There will not be many lectures, besides not-high quality videos could be watched.” (P 377), “We cannot remember so long as we do not take notes.” (P 390), “It is being told quickly.” (P 443), “Eyes and brain get tired due to adaptation.” ( P 417), “No, but it should not.” (P436), “Humans forget what they hear in two days. If they see them alive, they will not. Lectures should only be with videos.” (P394), “If we do not do it again, we can forget it very quickly” (P 407), “If it is long, the lesson will become boring. Students will not be interested in the lesson.” (P 432) , “Students can easily adapt.” (P 420), “Not really negative, it is boring but more understandable.” (P 118), “Its length.” ( P 195), “If it does not fluently instruct, we won’t understand and time will be wasted.” (P122), “Confusion” (P123), “I think following the book is better. For, the questions are generally based on the book.” (P 4), “It was so dreamy.”(P 49), “I do not think there is any negative side, if there is no misinformation. And it shows us what happened in the ancient age. Thus, this lesson is so important” (P 55), “It does not instruct any more detailed.”(P 3), “They instruct so fast.” (P 21), “When that person is talking, this person does not tell us write down the important parts, but if it were the teacher, the teacher would have us write important parts.” (P 50), “It could be distracting if you do not watch it individually.” (P 401).
Lastly, the question included in the qualitative study and aimed about students’ attention was that “How did this instruction methods (video-aided lesson) affect your attention to the class? Can you explain”
A great majority of the participants (77,25% ratio) stated as an answer that video-aided lesson has affected their attention positively.
Some of the participant opinions about this subject is as it follows:
“Some curiosity.” ( P 337), “I am visually impressed.” (P 374), “It has caught my attention.” (P 392), “It helped us focus on faster.” ( P 411), “It has increased the interest towards the class.” (P383), “Our perspective on the class has changed.” (P 394), “It was positive since I focused on the video itself.” (P 387), “I wish video-aided education would increase.” ( P 342), “The visuals in the video got me to focus on the lesson.” ( P 166), “We adapt much better.” (P 1), “It has made us love history a lot more.” (P 34), “It has created curiosity in me, I will go and buy a book about the events taking place in this video.”(P 5), “Curiosity ( P 14), “If the visual is interesting, understanding is easier.” ( P 52), “It has affected me visually.” (P 55), “It has affected me positively as it is both catchier and more logical.” (P 59),”I liked that it shows the buildings.” (P 38), “I do not lose my attention easily. (P 421), “Yes, since it is a video, I watched more curiously, and it caught my attention more.” (P 418), “If the instructor teaches us in the lesson after watching the video, we learn the lesson together in an enjoyable way.” (P 252).
4. Discussion, Conclusion and Suggestions
The purpose of this study is to conduct a research about the effect of the different contents provided with video on the academic success. Videos are multimedia tools in which pictures and words that could be presented in different ways are brought together in order to make learning easier (Rapp et al., 2016). In literature, it is defended that videos are effective teaching tools (Soucy et al., 2016) and they affect the users’ attitudes positively by increasing their awareness (Orús et al., 2016; Alhawiti and Abdelhamid, 2017; Tam et al., 2017) . It is also pointed out the fact that videos which are among digital age’s popular multimedia tools are more effective in the process of learning as opposed to motionless pictures (Rasch and Schnotz, 2009). In this study, quite interesting conclusions were made about the use different contents in the process of video contents. Especially it was observed that components used with audio and textual expressions do not cause loss of focus and students learn better. Apart from that, it was determined that animations catch attention. Accordingly, it could be argued that multimedia design principles suggested by Mayer (2009) are not valid for every learning process. The conclusions of the study could be listed as it follows below:
- The effect of media elements on process of learning could differ in accordance with learning activity done.
- Even though there are many variables affecting learning success, it is observed that learning activities in which proper media elements and proper subject contents are more successful.
- Videos remain to be effective learning tools.
- The use of audio, textual and animation elements together could not affect much to decrease videos’ loss of attention effect.
- In that sense, taking into account the suggestions below could be beneficial:
- Different conclusions could be made by conducting researches with different samples and the effect of videos could be researched in a more detailed way.
- The contents that are to be used with videos (audio, text, animations etc.) could be used in different combinations and by doing so, the effect of multimedia tools on learning process could be tested.
References
Akdemir, A.S., 2017. Etwinning in language learning: The perspectives of successful teachers. Journal of Education and Practice, 8(10): 182-190.
Akkoyunlu, B. and M. Yılmaz, 2005. Derivative multimedia learning theory Hacett. Hacettepe University Faculty of Education Journal, 28: 9-18.
Alhawiti, M.M. and Y. Abdelhamid, 2017. A personalized e-learning framework. Journal of Education and e-Learning Research, 4(1): 15-21.
Angeli, C. and A. Tsaggari, 2016. Examining the effects of learning in dyads with computer-based multimedia on third-grade students' performance in history. Computers & Education, 92(C): 171-180.Available at: https://doi.org/10.1016/j.compedu.2015.10.015.
Barton, K.C. and L.S. Levstik, 2003. Why don’t more history teachers engage students in interpretation? Social Education, 67(6): 358-361.
Bates, W.A., 2015. Teaching in a digital age, guidelines for designing teaching and learning. Vancouver, Canada Bc: Tony Bates Associates Ltd. pp: 38,70,236,276.
Beck, D. and J. Eno, 2012. Signature pedagogy: A literature review of social studies and technology research. Computers in the Schools, 29(1-2): 70-94.Available at: https://doi.org/10.1080/07380569.2012.658347.
Berson, I. and M. Berson, 2009. Making sense of social studies with visualization tools. Social Education, 73(3): 124-126.
Berson, M.J. and P. Balyta, 2004. Technological thinking and practice in the social studies: Transcending the tumultuous adolescence of reform. Journal of Computing in Teacher Education, 20(4): 141-150.
Brush, T. and J. Saye, 2008. The effects of multimedia-supported problem-based inquiry on student engagement, empathy, and assumptions about history. Interdisciplinary Journal of Problem-Based Learning, 2(1): 21-56.Available at: https://doi.org/10.7771/1541-5015.1052.
Chou, C.C., L. Block and R. Jesness, 2012. A case study of mobile learning pilot project in K-12 schools. Journal of Educational Technology Development and Exchange, 5(2): 11-26.Available at: https://doi.org/10.18785/jetde.0502.02.
Creswell, W.J. and P.L.V. Clark, 2014. Designing and conducting mixed methods reserarch, trans.Ed: Dede,Y.& Demir, B. S.,3. Bölüm translator: Delice, A. Ankara-Turkey: Anı Publishing. pp: 79.
Crook, C., 1996. Computers and the collaborative experince of learning. London and New York: Routledge, International Library of Psychology.
Demirel, N., İ., 2018a. Dön the perspectives on the competence of using educational technology and the perspectives of the prospective teachers on the attitudes of the assistant staff in school ili. Turkish Studies Information Technologies & Applied Sciences, 13(6): 53-68.Available at: http://dx.doi.org/10.7827/TurkishStudies.13160.
Demirel, N.İ., 2018b. The viewpoints of the teacher candidates about the terms of sufficiency of education programme and education environment. Universal Journal of Educational Research, 6(5): 1077-1083.Available at: http://www.hrpub.orgDOI:10.13189/ujer.2018.060529.
Diaz, A., J. Middendorf, D. Pace and L. Shopkow, 2008. The history learning project: A department “decodes” its students. Journal of American History, 94(4): 1211-1224.Available at: https://doi.org/10.2307/25095328.
Ekiz, D., 2015. Scientific research methods. Ankara-Turkey: Anı Publishing. pp: 112.
Gündüz, Ş., 2017. D selection of multimedia applications tasarım, multimedia design, Ed: Dursun, Ö.Ö. & Odabaşı, H.F., Unit 12. Ankara-Turkey: Pegem Akademi Publishing. pp: 235-252.
Hammond, T.C. and M.M. Manfra, 2009. Giving, prompting, making: Aligning technology and pedagogy within TPACK for social studies instruction. Contemporary Issues in Technology and Teacher Education, 9(2): 160-185.
Harding, D. and B. Ingraham, 2007. The art of design, rethinking pedagogy for a digital age- Designing and delivering e-learning. Edited by Helen Beetham and Rhona Sharpe. New York: Routledge. pp: 142-153.
Hardy, J. and A. Jefferies, 2010. How learners change-critical moments, changing minds rethinking learning for a digital age - how Learners are shaping their own experiences. Edited by. Rhona Sharpe, Helen Beetham & Sara De Freitas. New York: Routledge. pp: 114-127.
Hofer, M.J. and K. Swan, 2014. Technology and disciplined inquiry in the social studies. Contemporary Issues in Technology and Teacher Education, 14(1): 25-30.
Johnson, B. and Christensen, 2014. Educational studies (Quantitative, Qualitative and Mixed Approaches). Trans Ed: Demir, B.S. 4th Edn., Ankara-Turkey: Eğiten Kitap Publishing.
Joseph, R. and H.-E. Joy-Telu, 2016. A review of digital addiction: A call for safety education. Journal of Education and e-Learning Research, 3(1): 17-22.Available at: https://doi.org/10.20448/journal.509/2016.3.1/509.1.17.22.
Kaya, Z. and A.S. Akdemir, 2016. Learning and teaching: Theories approaches and models. Ankara: Solution Education Publishing.
Kelly, T., 2013. Teaching history in the digital age. Michigan, USA: University of Michigan Press.
Kelly, T.M., 2001. Using new media to teach East European history. Nationalities Papers, 29(3): 499-507.Available at: https://doi.org/10.1080/00905990120073735.
Kingsley, K.V. and R. Boone, 2008. Effects of multimedia software on achievement of middle school students in an American history class. Journal of Research on Technology in Education, 41(2): 203-221.Available at: https://doi.org/10.1080/15391523.2008.10782529.
Kobrin, D., 2001. Using history matters with a ninth grade class. The History Teacher, 34(3): 339-343.Available at: https://doi.org/10.2307/3054344.
Krauss, J. and S. Boss, 2013. Thinking through project-based learning: Guiding deeper inquiry. U.S.A: Corwin a Sage Company. pp: 87.
Kurihara, Y., 2016. Flipped classroom: Effects on education for the case of economics. Journal of Education and e-Learning Research, 3(2): 65-71.Available at: https://doi.org/10.20448/journal.509/2016.3.2/509.2.65.71.
Kuzu, A., 2017. D theoretical basics of multimedia applications, multimedia design, Ed: Dursun, Ö.Ö. & Odabaşı, H.F., Unit 1. Ankara-Turkey: Pegem Academy Publications. pp: 1-35.
Lee, J.K., P.E. Doolittle and D. Hicks, 2006. Social studies and history teachers’ uses of non-digital and digital historical resources. Social Studies Research and Practice, 1(3): 291-311.
Marone, F., 2017. Engaging in the classroom: Learning and teaching through digital stories. Multidisciplinary Digital Publishing Institute Proceedings, 1: 971.
Masterman, E. and Y. Rogers, 2002. A framework for designing interactive multimedia to scaffold young children's understanding of historical chronology. Instructional Science, 30(3): 221-241.
Mayer, R. and V. Sims, 1994. For whom is a picture worth a thousand words? Extensions of a dual-coding theory of multimedia learning. Journal of Educational Psychology, 86(3): 389-401.Available at: https://doi.org/10.1037/0022-0663.86.3.389.
Mayer, R.E., 2003. The promise of multimedia learning: Using the same instructional design methods across different media. Learning and Instruction, 13(2): 125-139.Available at: https://doi.org/10.1016/s0959-4752(02)00016-6.
Mayer, R.E., 2009. Multimedia learning. 2nd Edn., New York: Cambridge University Press.
Mayer, R.E. and R. Moreno, 2003. Nine ways to reduce cognitive load in multimedia learning. Educational Psychologist, 38(1): 43-52.Available at: https://doi.org/10.1207/s15326985ep3801_6.
Miles, B.M. and A.M. Huberman, 2015. Qualitative data analysis: An expanded sourcebook. (Sadegül Akbaba Altun & Ali Ersoy, Trans., Eds.). London, UK: Sage Publication.
Mishra, P. and M. Koehler, 2006. Technological pedagogical content knowledge: A framework for teacher knowledge. Teachers College Record, 108(6): 1017-1054.Available at: https://doi.org/10.1111/j.1467-9620.2006.00684.x.
Mohamad, R. and T.S. Chong, 2011. An adaptive multimedia courseware for the students’ different cognitive styles: A pilot study for history subject. Procedia Computer Science, 3: 301-306.Available at: https://doi.org/10.1016/j.procs.2010.12.051.
Moreno, R. and R. Mayer, 2007. Interactive multimodal learning environments. Educational Psychology Review, 19(3): 309-326.Available at: https://doi.org/10.1007/s10648-007-9047-2.
Oostveen, V.R., W. Muirhead and W.M. Goodman, 2011. Tablet PCs and reconceptualizing learning with technology: A case study in higher education. Interactive Technology and Smart Education, 8(2): 78-93.Available at: https://doi.org/10.1108/17415651111141803.
Orús, C., M.J. Barlés, D. Belanche, L. Casaló, E. Fraj and R. Gurrea, 2016. The effects of learner-generated videos for youtube on learning outcomes and satisfaction. Computers & Education, 95(C): 254-269.Available at: https://doi.org/10.1016/j.compedu.2016.01.007.
Patton, M.Q., 2014. Qualitative research & evaluation methods. Trans Ed: Tüm, M. & Demir, S.B. 3rd Edn., Ankara-Turkey: Sage Publications, Pegem Academy.
Ragland, R.G., 2015. Sustaining changes in history teachers' core instructional practices: Impact of teaching American history ten years later. The History Teacher, 48(4): 609-640.
Rapp, A.K., M.G. Healy, M.E. Charlton, J.N. Keith, M.E. Rosenbaum and M.R. Kapadia, 2016. Youtube is the most frequently used educational video source for surgical preparation. Journal of Surgical Education, 73(6): 1072-1076.Available at: https://doi.org/10.1016/j.jsurg.2016.04.024.
Rasch, T. and W. Schnotz, 2009. Interactive and non-interactive pictures in multimedia learning environments: Effects on learning outcomes and learning efficiency. Learning and Instruction, 19(5): 411-422.Available at: https://doi.org/10.1016/j.learninstruc.2009.02.008.
Robson, C., 2015a. Real world research, Trans.Ed: Çınkır, Ş & Demirkasımoğlu, N. Publication, Ankara-Turkey. pp: 199.
Robson, C., 2015b. Scientific research methods- real world research. London, UK: Memoir Publishing. pp: 133.
Romrell, D., L.C. Kidder and E. Wood, 2014. The SAMR model as a framework for evaluating m learning. Journal of Asynchronous Learning Networks, 18(2): 1-15.Available at: https://doi.org/10.24059/olj.v18i2.435.
Sarikaya, B., 2016. Ina the effects of structured images according to problem solving steps on writing skills and attitudes of students with hearing impairment of 6th, 7th and 8th grades çöz. T.C. Atatürk University, Institute of Educational Sciences, Department of Turkish Language Teaching. PhD Thesis. (Unpublished PhD Thesis).
Sarikaya, B., 2017. Visual reading in Turkish language teaching. Anemon Muş Alparslan University Journal of Social Sciences, 5(3): 779-796.
Sarikaya, B., 2018. Effect of images structured according to problem solving stepson sixth, seventh and eighth grade hearing impaired students' skills towards writing. Asos Journal. Academic Journal of Social Research 6(70): 57-70.
Schrum, K., 2001. Making history on the web matter in your classroom. The History Teacher, 34(3): 327-337.Available at: https://doi.org/10.2307/3054343.
Schrum, L. and S. Hong, 2002. Dimensions and strategies for online success: Voices from experienced educators. Journal of Asynchronous Learning Networks, 6(1): 57-67.
Schwab, K., 2016. The fourth industrial revolution, the world economic forum. Zulfu Dicleli: The Optimist Publications. pp: 15.
Seixas, P., 1994. Confronting the moral frames of popular film: Young people respond to historical revisionism. American Journal of Education, 102(3): 261-285.Available at: https://doi.org/10.1086/444070.
Sharpe, R., H. Beetham, S.D. Freitas and C. Gráinne, 2010. An introduction to rethinking learning for a digital age Rethinking learning for a digital age - how learners are shaping their own experiences. Edited by. Rhona Sharpe, Helen Beetham & Sara De Freitas. New York: Routledge. pp: 1-13.
Siti, O.Z.M., R. Jamaludin and N.F. Fathil, 2016. An analysis of using online video lecture on learning outcome: The mediating role of student interaction and student engagement. Journal of Education and e-Learning Research, 3(2): 57-64.Available at: https://doi.org/10.20448/journal.509/2016.3.2/509.2.57.64.
Sonmez, V. and G.F. Alacapınar, 2016. Cılık illustrated scientific research methods scientific. Ankara-Turkey: Anı Publishing. pp: 60.
Soucy, J.N., V.A. Owens, H.D. Hadjistavropoulos, D.D. A. and B.F. Dear, 2016. Educating patients about internet-delivered cognitive behaviour therapy: Perceptions among treatment seekers and non-treatment seekers before and after viewing an educational video. Internet Interventions, 6: 57-63.
Söylemez, Y., 2015. Temel developing critical basic language skills scale for secondary school students. Ine Unpublished PhD Thesis. Atatürk University Institute of Educational Sciences. Erzurum.
Söylemez, Y., 2016. Content analysis critical thinking. Ekev Akademi Magazine, 20(66): 671-696.
Söylemez, Y., 2018. Critical thinking and writing in the skill approach in education: From theory to practice. (Ed: Firdevs Güneş & Yusuf Söylemez). Newcastle: Cambridge Scholars Publishing. pp: 296-310.
Swan, K., 1994. History, hypermedia, and criss-crossed conceptual landscapes: Designing hypermedia applications to support the development of historical thinking. Educational Multimedia and Hypermedia, Proceedings of ED-MEDIA 94--World Conference onEducational Multimedia and Hypermedia (Vancouver,British Columbia, Canada, June 25-30, 1994).
Swan, K. and D. Locascio, 2008. Evaluating alignment of technology and primary source use within a history classroom. Contemporary Issues in Technology and Teacher Education, 8(2): 175-186.
Tam, J.W., C. Van Son, D. Dyck and M. Schmitter-Edgecombe, 2017. An educational video program to increase aging services technology awareness among older adults. Patient Education and Counseling, 100(8): 1564-1571.Available at: https://doi.org/10.1016/j.pec.2017.03.020.
Turan, Z., M.R. Yilmaz, L. Durdu and Y. Göktaş, 2016. Historical change of instructional technologies , fundamentals of instructional technologies - theories, researches., Editors: Kürşat Çağıltay & Yüksel Göktaş. Ankara-Turkey: Pegem Academy. pp: 25-40.
Weis, T., 2001. Evaluating websites for history teachers: Using history matters in a graduate seminar. The History Teacher, 34(3): 345-351.Available at: https://doi.org/10.2307/3054345.
Yazıcı, C. and C. Kültür, 2016. Y my media method? Endless discussion Te, fundamentals of instructional technology - theories, researches, trends,. Ed: Cagiltay, K & Goktas, Y. Ankara-Turkey: Pegem Academy. pp.123-140.
Yıldırım, A. and H. Simşek, 2013. Qualitative research methods in the social sciences. Ankara-Turkey: Seçkin Publishing. pp: 256.
Appendices
Appendix-1. Application-Video-1-Concepts of Time Used in the Examination of Historical Events-I: Concepts of Time Used in the Examination of Historical Events-II. (Test 1)
Questions
1) Which one of followings below is the science field that History benefits from to determine and put in an order time, calendar science and the events that took place in the past?
a) Anthropology b) Archeology c) Chronology d) Philology e) Paleography
2)Which one of the following is the calendar based on Lunar year used by Turks?
a)Jalali Calendar b)Rumi Calendar c)Gregorian Calendar d) Turkish Twelve-Year Animal Cycle Calendar e) Muslim Calendar
3) Which one of the followings is the first republic to use Gregorian Calendar?
a) Egpyt b) Rome c) Sumerian d) Hittite e) Babel
4) Which one of the followings is the date Gregorian Calendar started to be used in our country?
a)1923 b)1926 c)1928 d)1931 e)1934
5)Which one of the followings is the start of Muslim Calendar which is based on Muhammad's migration from Mecca to Medina?
a)476 b)571 c)610 d)622 e)632
6) Which one of the followings is the number of days in total in Muslim Calendar? (How many days does Muslim Calendar consist of?)
a)344 days b)354 days c)365 days d)367 days e)369 days
7) Which one of the followings is the number of days in total in Gregorian Calendar? (How many days does Gregorian Calendar consist of?)
a)344 days b)354 days c)365 days d)367 days e)369 days
8)Which one of the followings is generally accepted as the date of start of the Modern Age?
a) Conquest of Istanbul b) Migration of Tribes c) Fall of Rome d) Fall of Western Rome
e) French Revolution
9) Which one of the followings is the language from which the word “week” is derived?
a) Indian b) Hebrew c) English d) Persian e) Arabic
10) Which one of the followings is the name of the day which means three, third and is derived from the word “salis”?
a) Monday b)Tuesday c)Wednesday d)Thursday e)Friday
11)Which one of the followings is notamong the names of the months in Muslim Calendar?
a) Kanunievvel b) Muharram c)Safar d) Rabi al-awwal e) Rabi al-akhir
12)Which one of the following is not among the names of the months in Rumi Calendar?
a) February b)March c)Teşrinievvel d)Teşrinisani e) Shawwal
13) Which one of the followings is one of the names of the months derived from Sumerian into our language?
a)March b)April c)June d)July e) August
14)Which one of the followings is the name of the month coming from the title of Roman Emperor Octavius and is used in our language?
a)March b)April c)June d)July e) August
15)Which one of the followings is the name of the month derived from Syriac into our language and means “grape month”?
a)September b)October c)November d)December e)January
16)Which one of the followings is the New Year’s Day according to Rumi Calendar?
a)January 1 b)February 1 c)March 1 d)April 1 e)May 1
17)Which one of the followings used to be used as the first month of the calendar based on solar year until 1582?
a)February b)March c)April d)May e)June
18)In which one of the followings’ period was the first month accepted as January in the calendar based on solar year (It was changed in 1582)
a)Caesar b)X.Charles c)XIII.Gregorius d)Uluğ Bey e)Gazan Han
19) Which one of the followings is the name of the month, which means hot in Syriac and Latin equivalent is Junius “youth, young”?
a)June b)July c)August d)September e)October
20) Which one of the followings are the calendars used in the Ottoman Period?
a)Muslim-Gregorian b)Gregorian-Rumi c)Jalali-Muslim d)Muslim-Rumi e)Muslim-Jalali
21) Which one of the followings is generally accepted as the start of New Age?
a) Conquest of Istanbul b) Migration of Tribes c) Fall of Rome d) Fall of Western Rome e) French Revolution
22) Which one of the followings means “the fourth day” in Persian?
a)Monday b)Tuesday c)Wednesday d)Thursday e)Friday
23)Which one of the followings is the name of the month in the calendar that we use today, which comes from Latin, gets its name from Maia, Mercury’s mother, who is also the goddess of spring and fertility who raises the plants in mythology?
a) January b) February c) March d) April e) May
24)Which one of the followings is the name of the month which comes from the Arabic word meaning dividing and parting and the old name of which is Teşrinisani derived from Syriac?
a)August b)September c)October d)November e)December
25)Which one of the followings is the month, old name of which is Kanunisani? ( Kanun means “oven” in Syriac.)
a)December b)January c)February d)March e)April
Appendix-2. Application_Video_2- Introduction to Ages of History and Anatolia, Cradle of Civilizations (Test 2)
Questions
1)Which one of the followings was born in Miletus in B.C.625 and became the first representative of the geometry in Ionia?
a)Pythagoras b)Hippocrates c)Herodotus d)Diogenes e)Tales
2) Which one of the followings is a scientist who lived in Ionia and is accepted as an important scientist?
a)Pythagoras b)Hippocrates c)Herodotus d)Diogenes e)Tales
3)In which one of the followings’ period was the King Road built?
a)Ionia b) Phrygians c)Lydia d)Urartu e)Egypt
4)Which one of the followings is the name of the country or the lands which a country conquers and rules outside of its borders due to economic, social and political reasons?
a)Dominion b)Colony c)Monarchy d)Theocracy e)Oligarchy
5)Which one of the followings is an Anatolian old age civilization that emerged Eastern Anatolian Region and came from Hurrians??
a)Urartu b)Phrygia c)Lydia d)Ionia e)Hittite
6)Which one of the followings is the scientist who discovered Ursa Minor?
a)Pythagoras b)Hippocrates c)Herodotus d)Diogenes e)Tales
7) Which one of the followings is the name of the civilization that was founded in Middle Anatolia and its center is Polatlı that is near to Ankara today?
a)Urartu b)Phrygia c)Lydia d)Ionia e)Hittite
8) Which one of the followings is the republic that was founded in the western part of Anatolia and established a great civilization in the region between Little Maeander and Gediz?
a)Urartu b)Phrygia c)Lydia d)Ionia e)Hittite
9)Which one of the followings is accepted as the founder of Phrygia Republic?
a)Gordius b) Hattusili I. c)Sarduri I. d)Gyges e)Alexander the Great
10)Which one of the followings is accepted as the founder of Lydia Republic?
a)Gordius b) Hattusili I. c)Sarduri I. d) Gyges e)Alexander the Great
11)Which one of the following eras is accepted as the era in which fire was found?
a)Paleolithic E. b)Mesolithic E. c)Neolithic E. d)Chalcolithic E. e) Protohistory E.
12)Which one of the followings is the name of the transition era between Stone Age and Bronze Age?
a)Paleolithic E. b)Mesolithic E. c)Neolithic E. d)Chalcolithic E. e)Protohistory E.
13) Which one of the followings is the name of the era known as Old Stone Era and refers to the longest era in human history?
a)Paleolithic E. b)Mesolithic E. c)Neolithic E. d)Chalcolithic E. e)Protohistory E.
14) Which one of the followings is the name of the era known as New Stone Age?
a)Paleolithic E. b)Mesolithic E c)Neolithic E. d)Chalcolithic E. e)Protohistory E.
15)Which one of the followings is the name given to the queen mother?
a)Labarna b) Antuhsa c)Antuhhil d)Panku e) Tavananna
16)Which one of the followings is the name of the council in Hittite?
a)Labarna b) Antuhsa c) Antuhhil d)Panku e) Tavananna
17)In between which one of followings was the Kadesh Treaty signed?
a)Hittite-Egypt b)Hittite-Urartu c)Hittite-Babel d)Hittite-Phrygia e)Egypt-Lydia
18)Which one of the followings is the scientist that lived in Ionia and has a great reputation in history field as he used to write by researching?
a)Herodotus b)Pythagoras c)Hippocrates d)Diogenes e)Tales
19)Which one of the followings are accepted as the first examples of pieces of art in human history?
a)Dolmens b) Cave Pictures c)Sculptures d)Ceramics e) Relieves
20)In which one of the following periods did production economy take place of the consumption economy?
a)Paleolithic E. b)Mesolithic E. c)Neolithic E. d)Chalcolithic E. e)Protohistory E.
21)Which one of the followings is accepted as the first city settlement in human history?
a)Gaziantep/Sakçagözü b)Diyarbakır/Çayönü c)Konya/Çatalhöyük d)Çorum/Alacahöyük
e)Ankara/Yassıhöyük
22)Which one of the followings is the other name of Copper Age?
a)Paleolithic E. b)Mesolithic E c)Neolithic E. d)Chalcolithic E. e)Protohistory E.
23)Which one of the followings is the civilization that went out of the history in Anatolia starting with B.C.2000?
a)Kaskians b)Hattians c)Hittite d)Urartus e)Ionians
24) Which one of the followings is the name of the settlement located in Sakarya Stream bank and near Polatlı?
a)Gaziantep/Sakçagözü b)Diyarbakır/Çayönü c)Konya/Çatalhöyük d)Çorum/Alacahöyük
e)Ankara/Yassıhöyük
25) I. They advanced in trade. They were founded in the West of Anatolia. They lived between B.C.687-B.C.546
II. Parallel to the mining, metalworking was also developed.
According to the information above, which one of the following match-ups is correct?
a)Hittite-Phrygia b)Lydia-Urartu c)Ionia-Urartu d)Hittite-Urartu e)Lydia-Hittite
Appendix-3 Qualitative Questions
1) Are you satisfied with the video education you watch in your history classes? Why? Can you explain? Yes/No.
2) What kind of positive sides do you think video-aided lesson have? Can you explain?
3) What kind of negative sides do you think video-aided lesson have? What do you think about it?
4) Do you think that this lesson method (video-aided education) makes your learning easier? Yes/No Why? Can you explain?
5) How did this instruction methods (video-aided lesson) affect your attention to the class? Can you explain?
6) Which video caught your attention more than the other in the lesson that we lectured with video-aid? Why? Can you explain?
Video-1- Concepts of Time Used in the Examination of Historical Events-I: Concepts of Time Used in the Examination of Historical Events-II.
Video-2- Introduction to Ages of History and Anatolia, Cradle of Civilizations
7) Which video in the lesson that we lectured with the video-aid do you think is the more beneficial than the other? Why? Can you Explain?
Video-1- Concepts of Time Used in the Examination of Historical Events-I: Concepts of Time Used in the Examination of Historical Events-II.
Video-2- Introduction to Ages of History and Anatolia, Cradle of Civilizations
Appendix-4. Application-Video-1- Concepts of Time Used in the Examination of Historical Events-I;
http://www.eba.gov.tr/video/izle/82005fee3f8a48ff446daaec0d942ee1768262d09c001
Concepts of Time Used in the Examination of Historical Events-II.
http://www.eba.gov.tr/video/izle/57775fee3f8a48ff446daaec0d942ee1768262d09c001
Appendix-5. Application-Video-2- Introduction to Ages of History and Anatolia, Cradle of Civilizations
http://www.eba.gov.tr/video/izle/video4f4cdc1f81fb0
http://www.eba.gov.tr/ is used for Application Videos